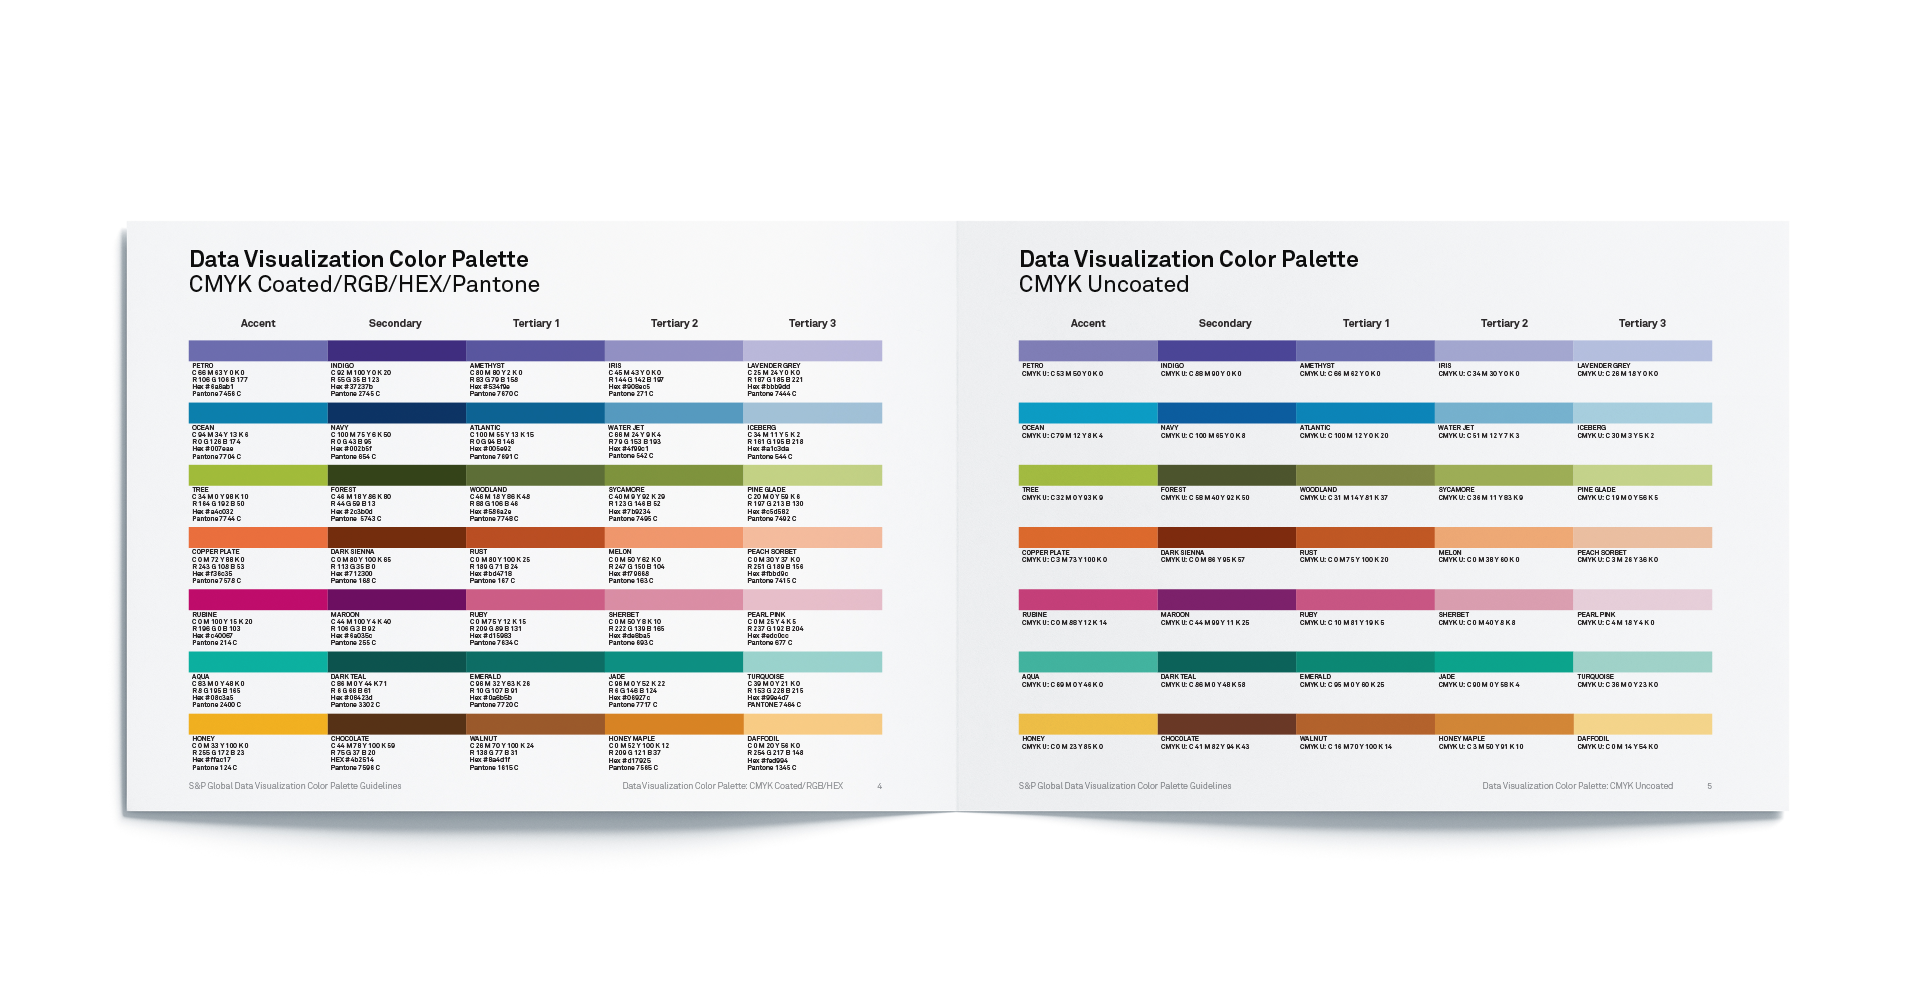
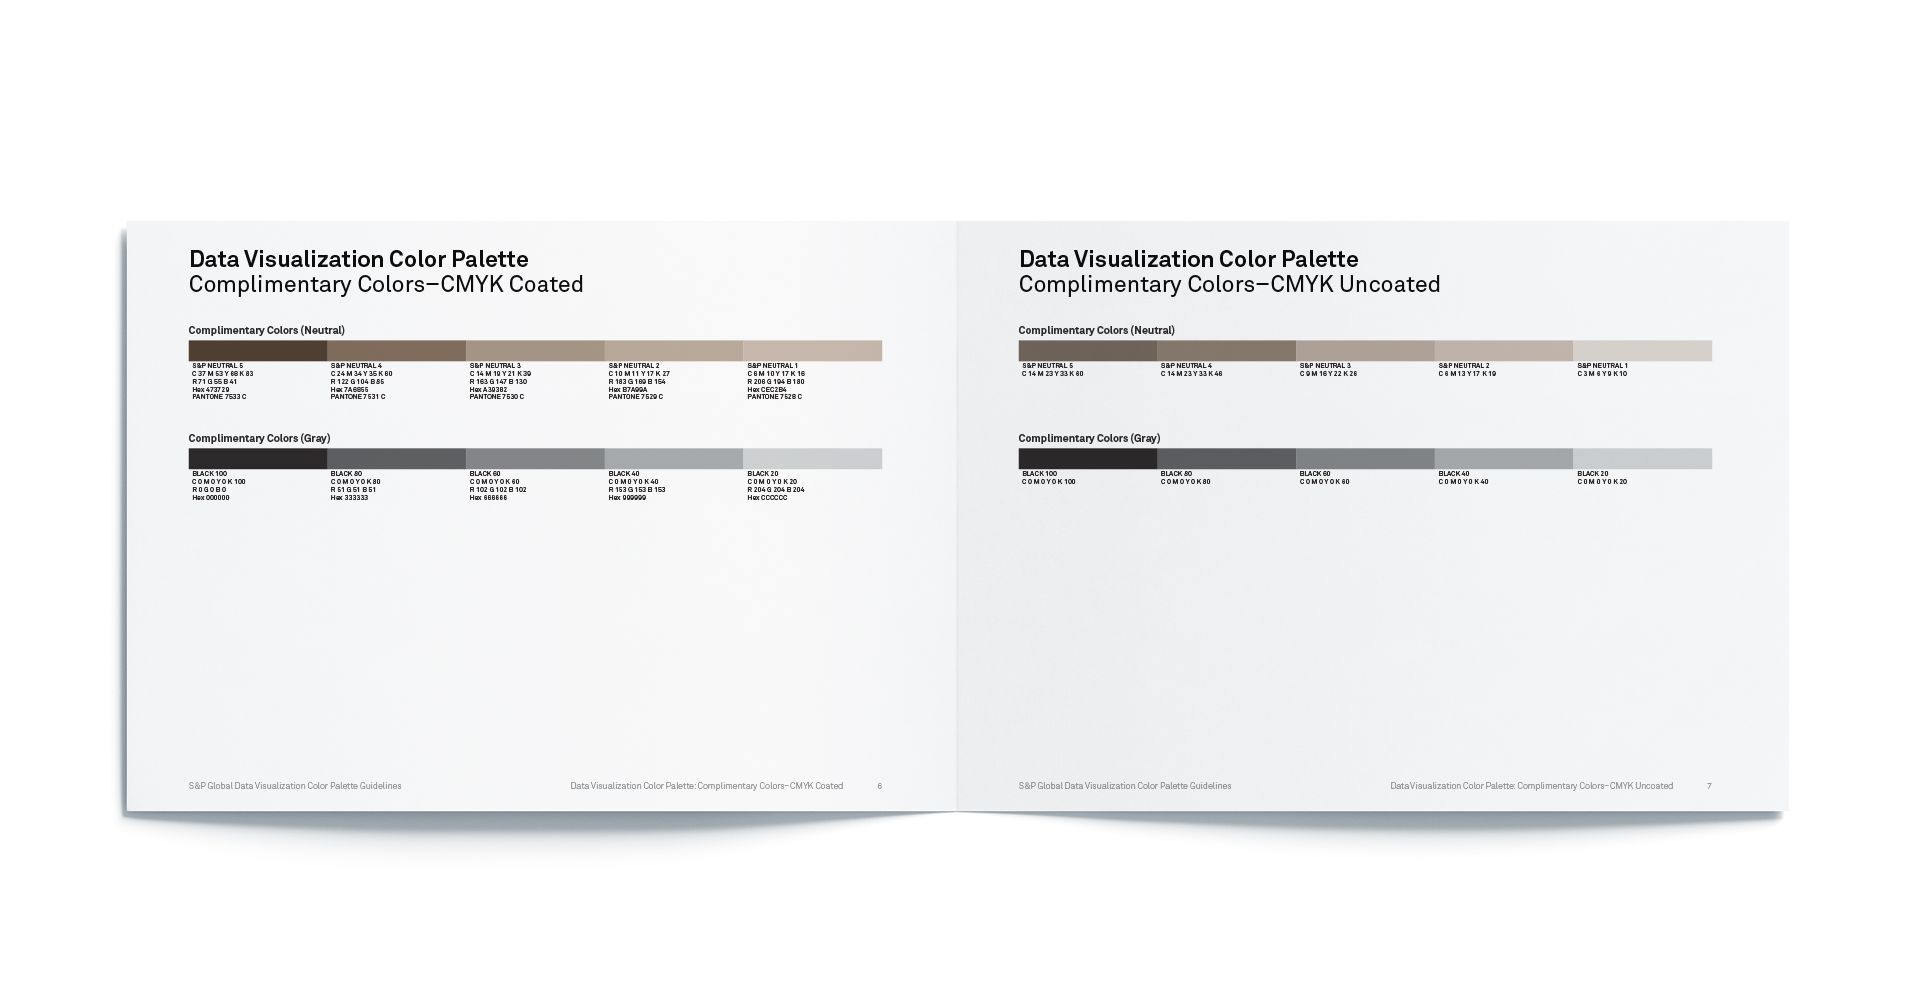
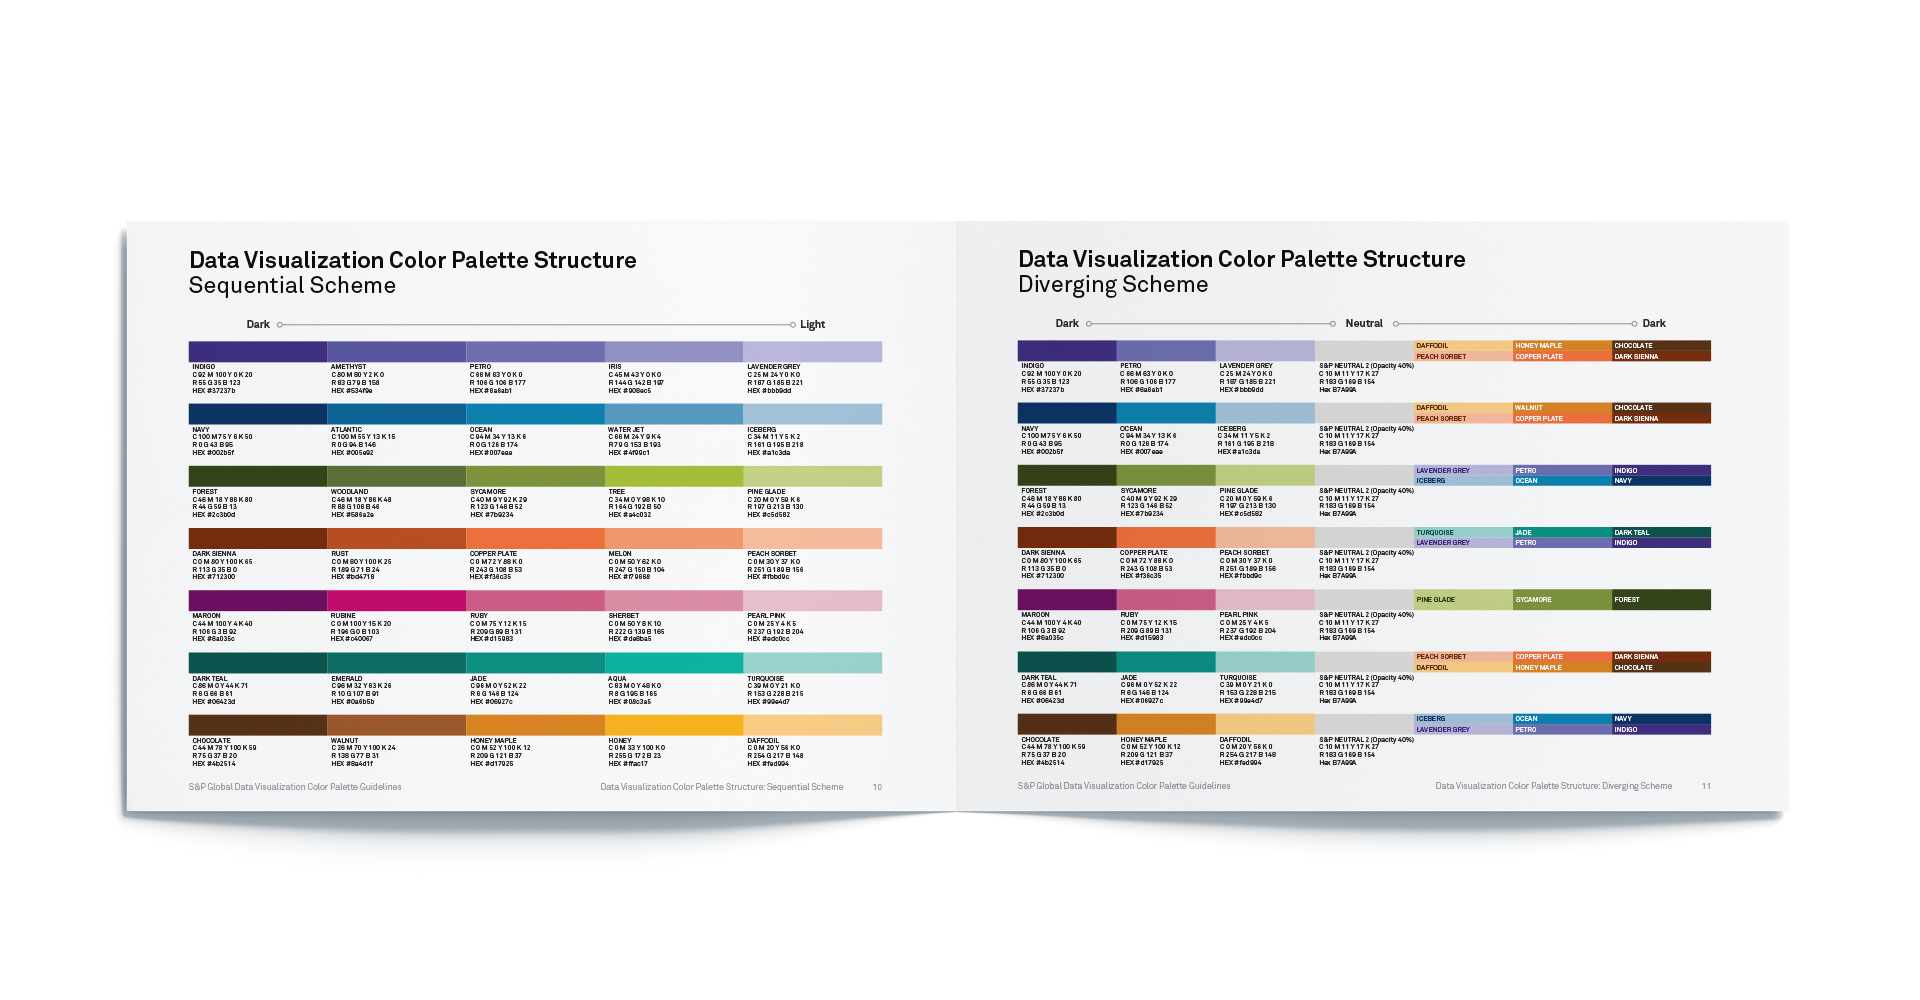
I was in charge of developing the Data Visualization Color Palette, elaborating in detail on how the colors should be used in data in Data Visualization Color Palette Guidelines.
Other responsibilities include introducing Data Visualization Color Palette across the entire company and ensuring company-wide adoption. Once the palette was adopted, my role was to educate the entire design team, production teams, and other frequent users on the effective use of colors.
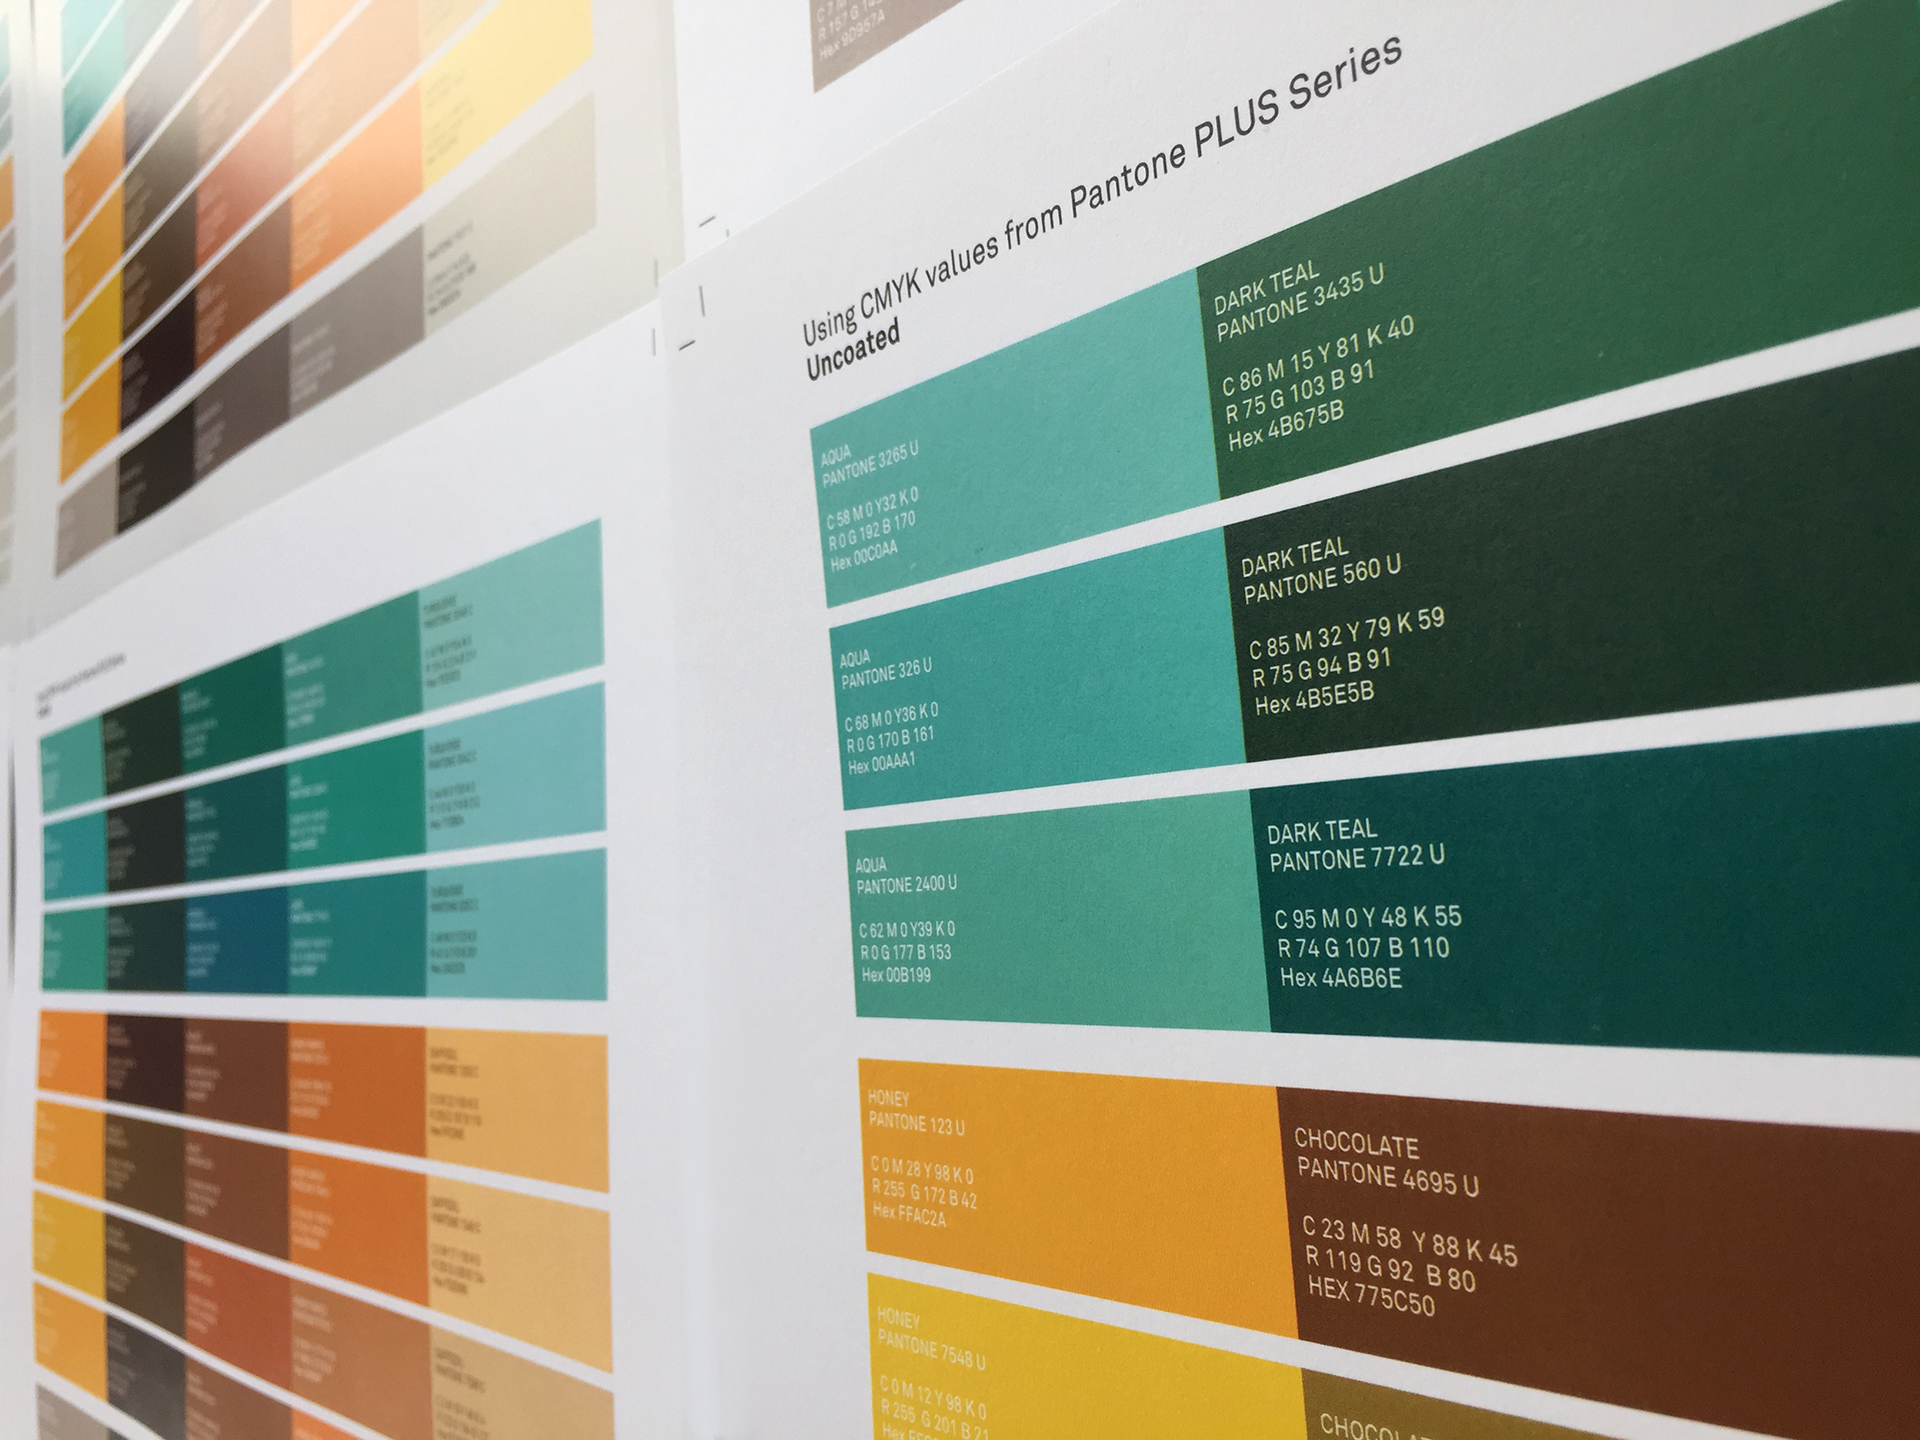
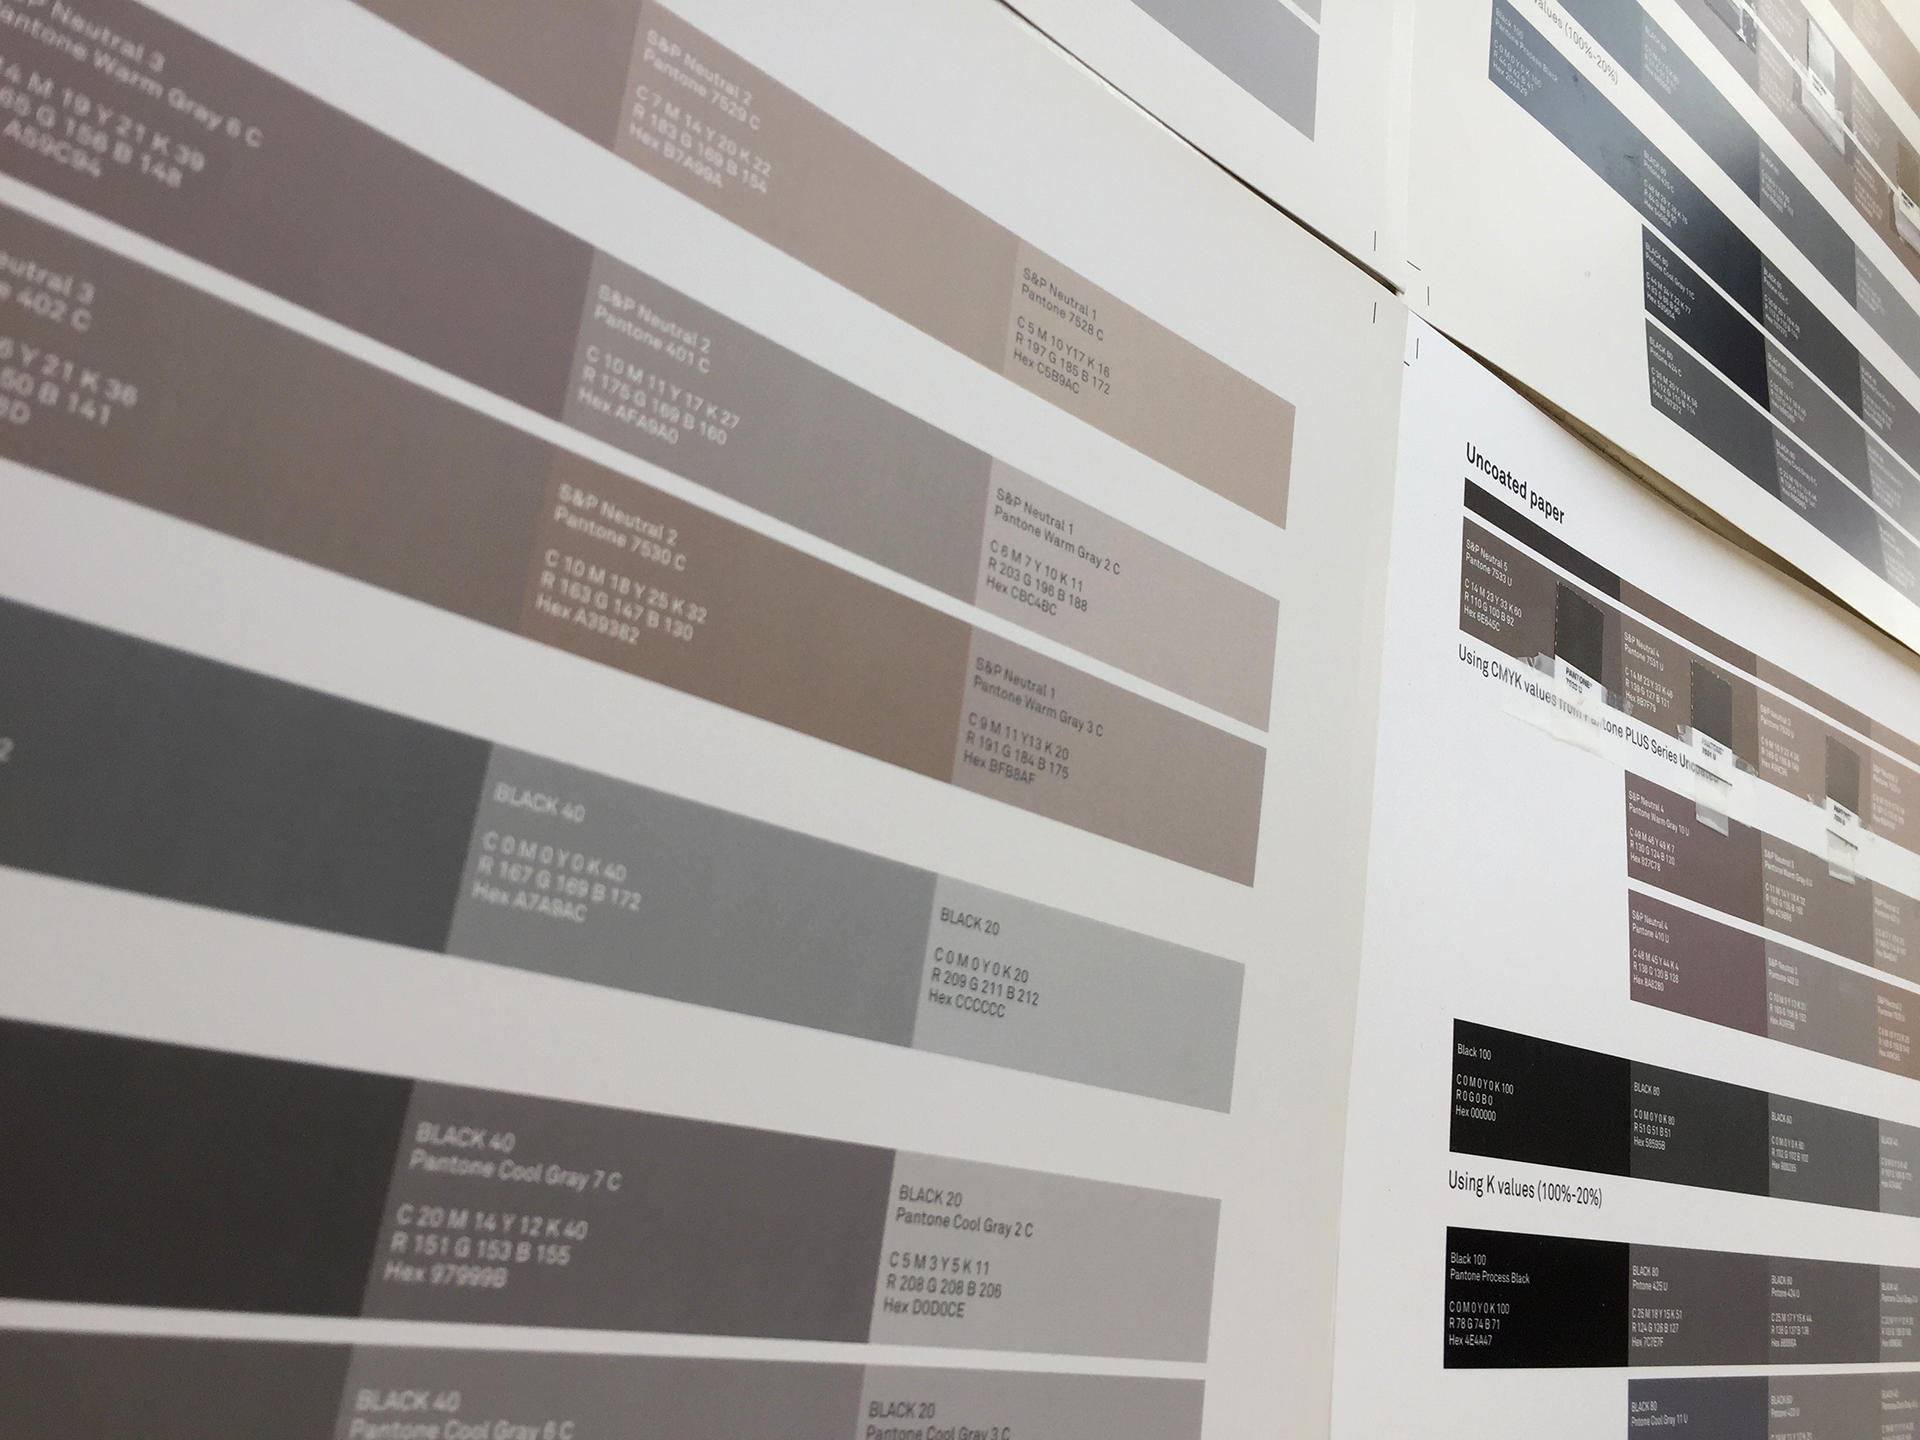
I also led the color testing between screen/RGB and print/CMYK to keep colors consistent across all mediums as well as implementing the color palette into PowerPoint where the colors had to be easily accessible across PC and Mac users.
My Role:
Stakeholder Interviews
Audit
Color Testing
Pressure Testing
Implementation
Guidelines
Audit
Color Testing
Pressure Testing
Implementation
Guidelines
The Team:
Shani S. (ECD)
Yu (AD)
Hael F. (Project Management)
Yu (AD)
Hael F. (Project Management)
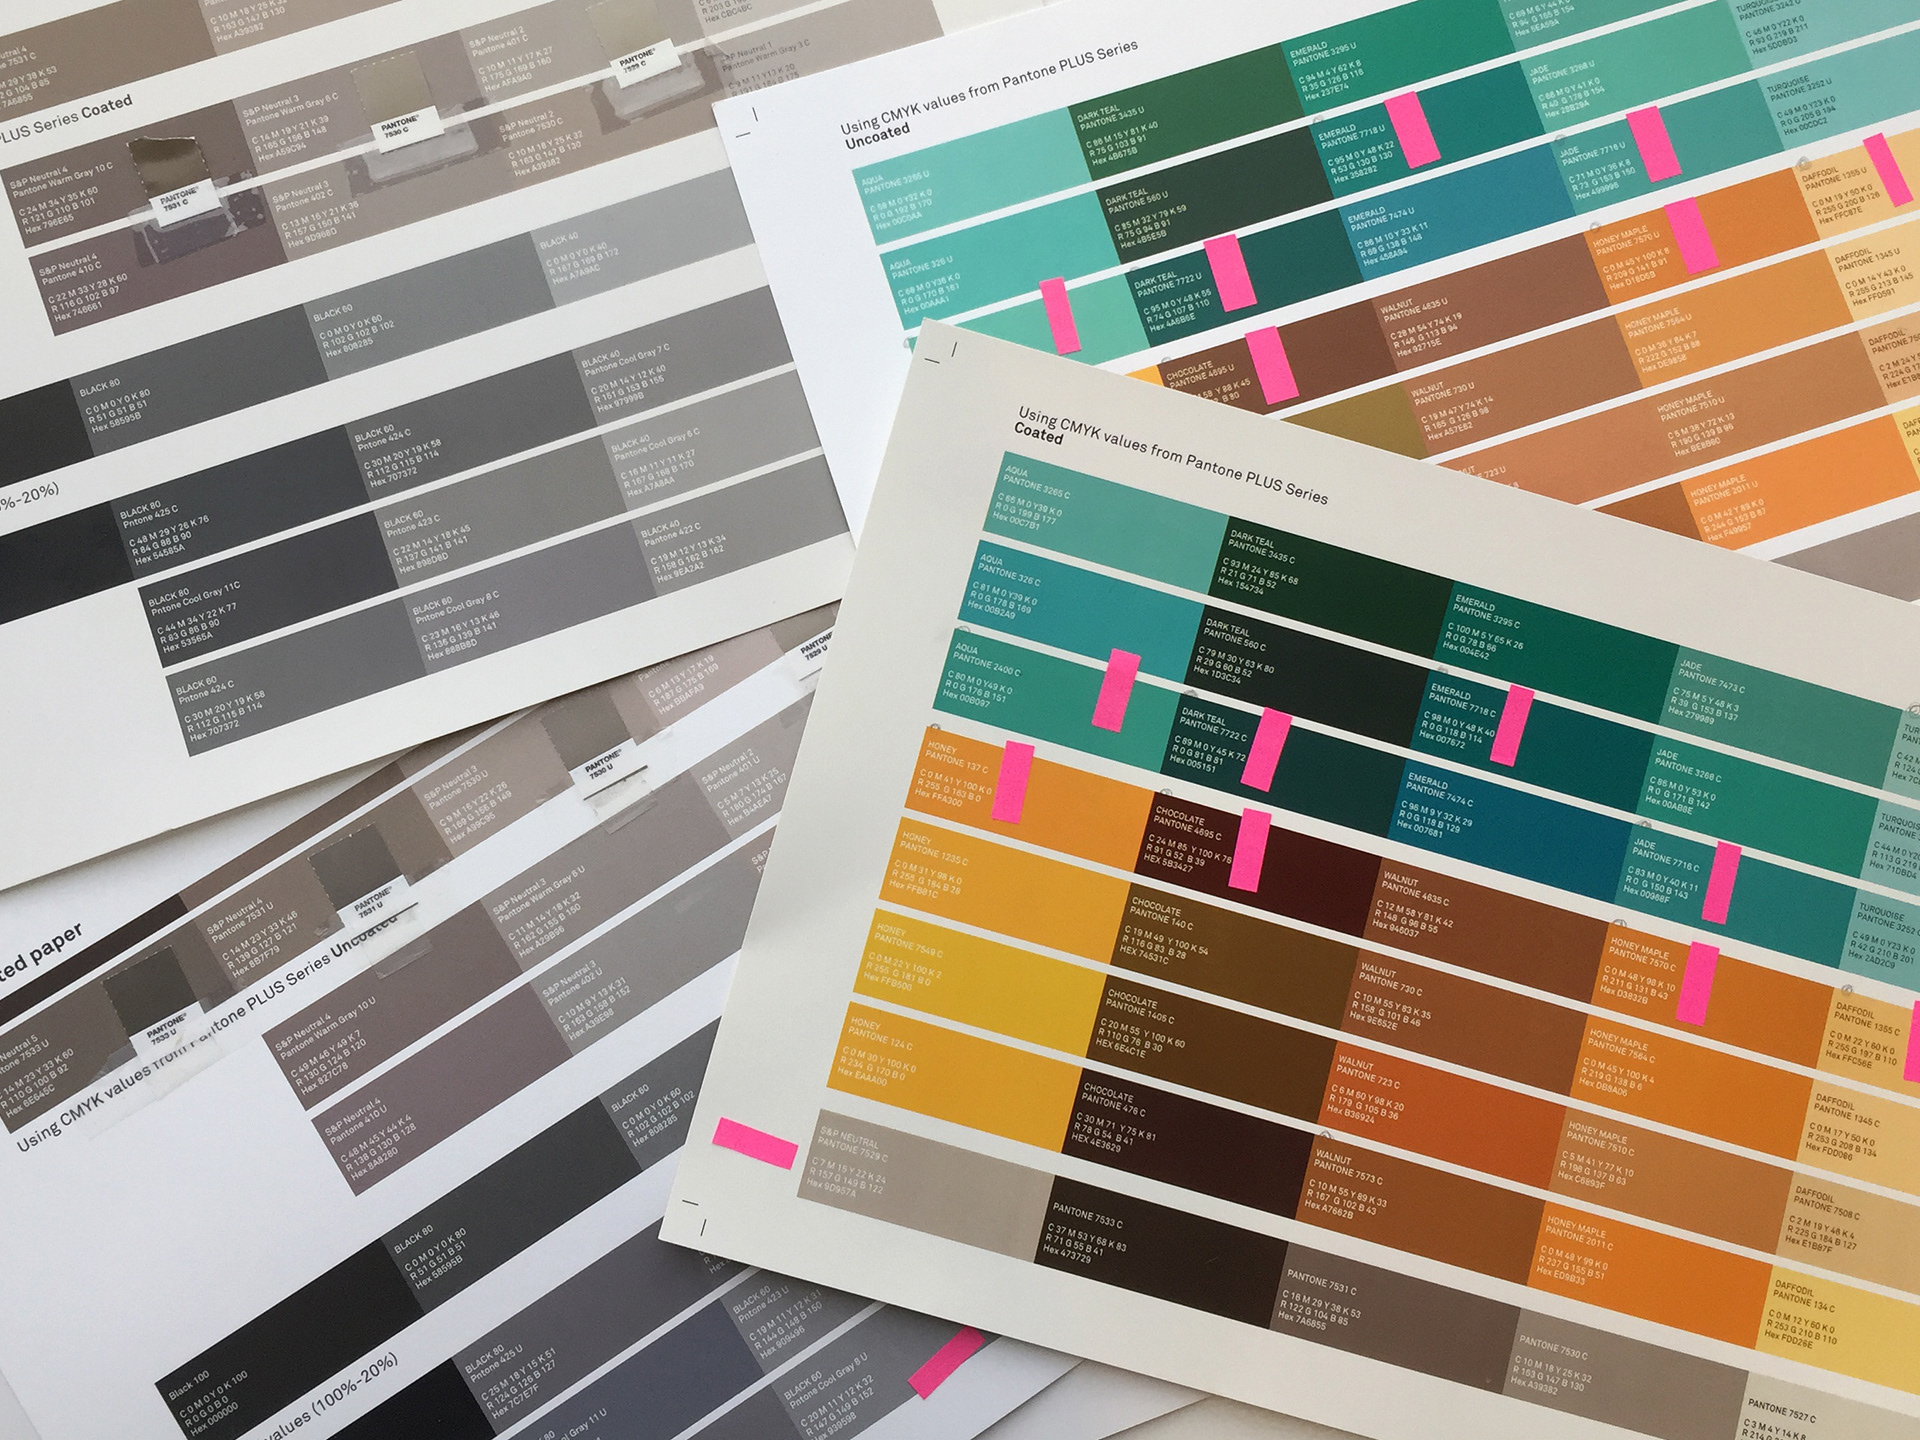
Color testing
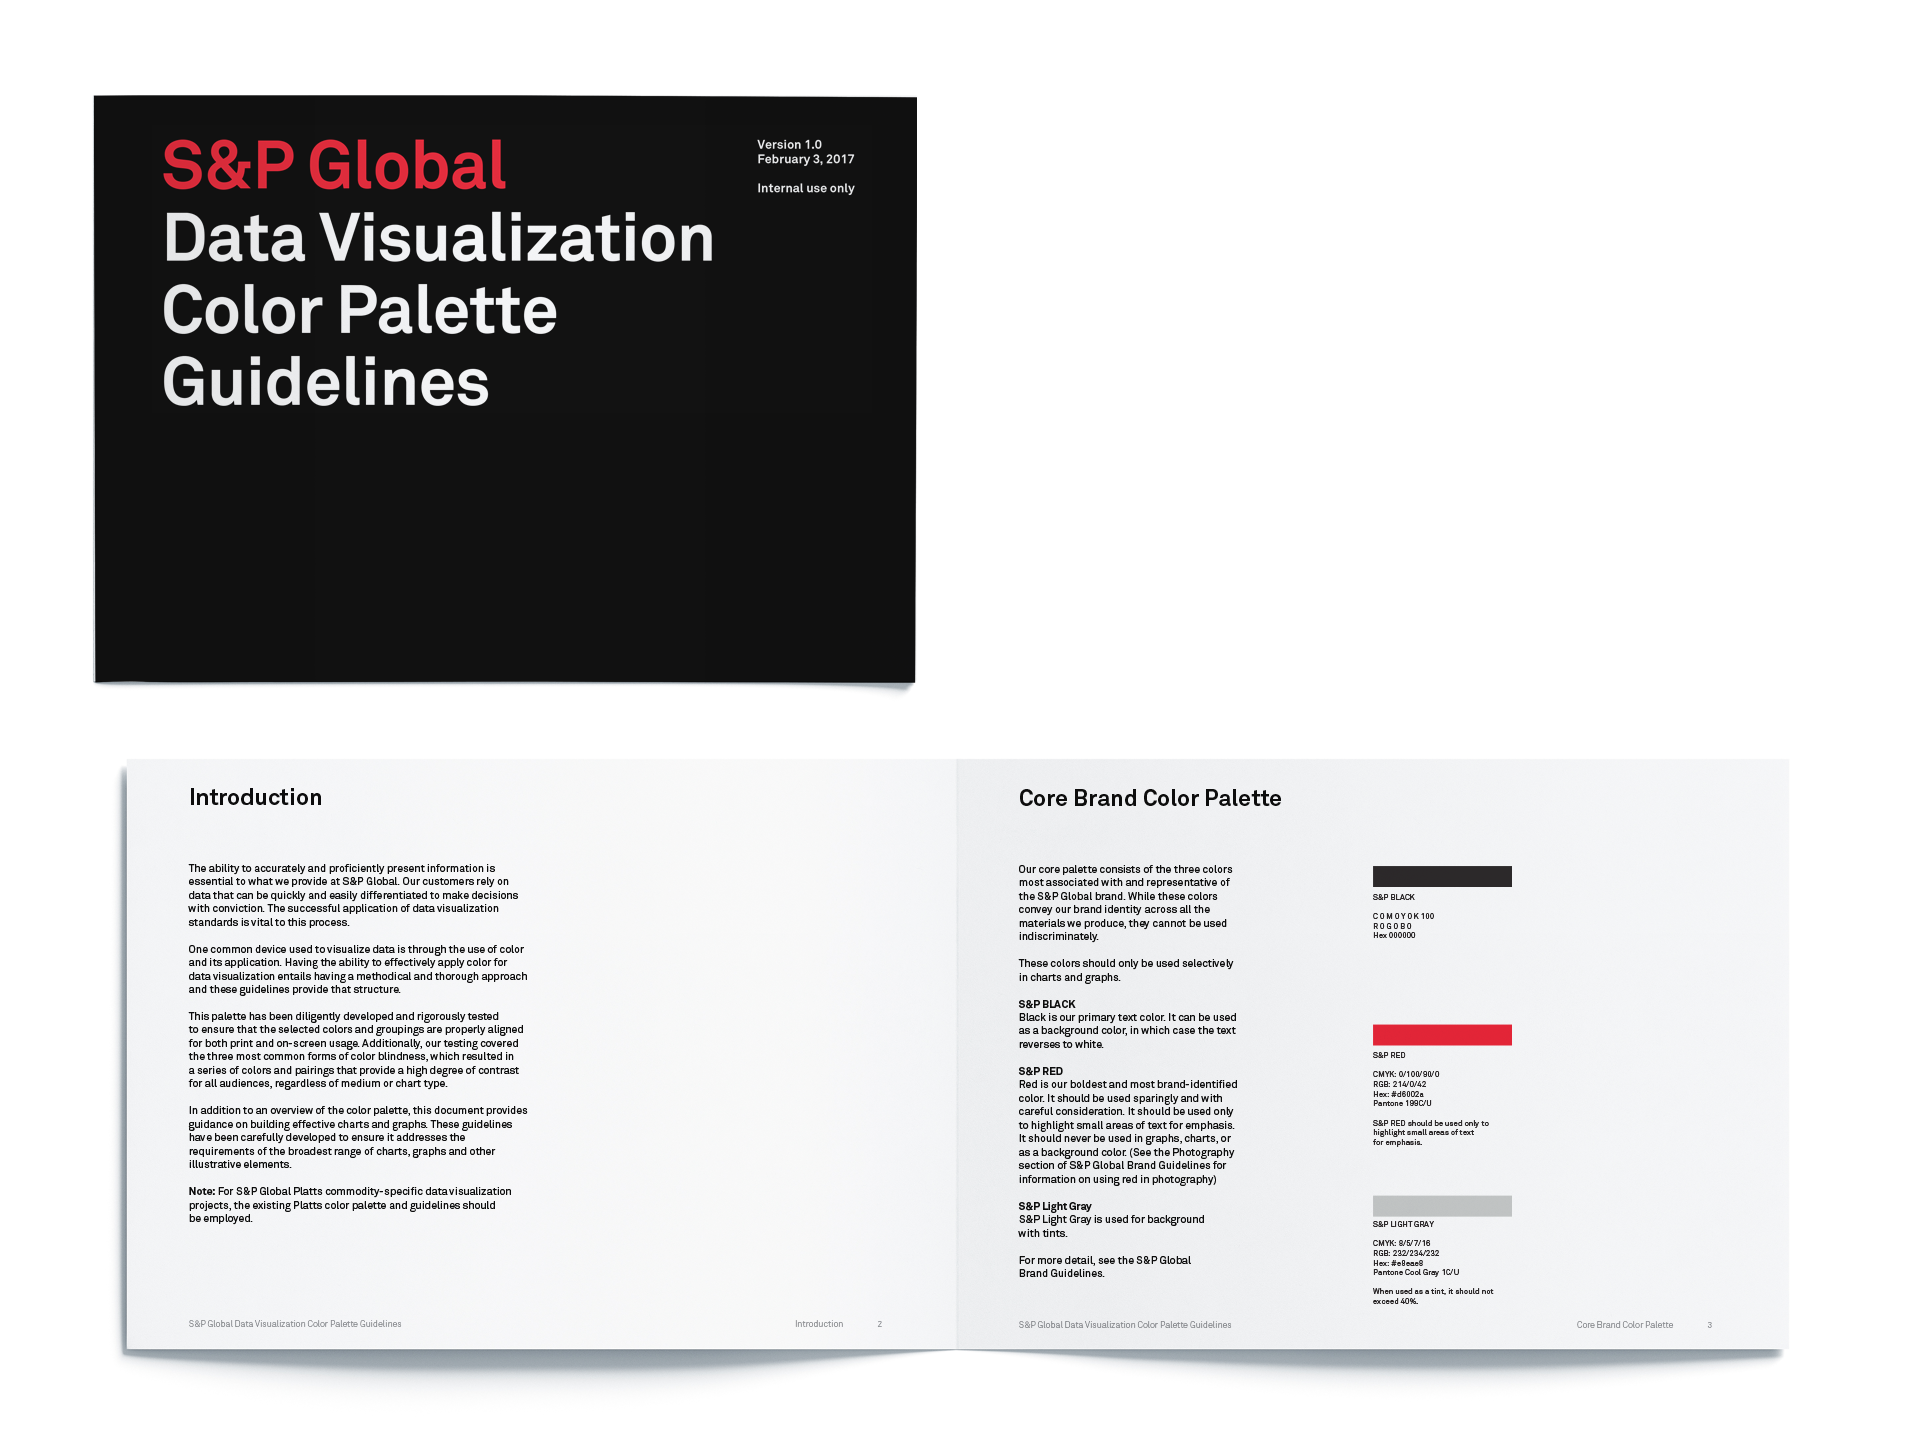
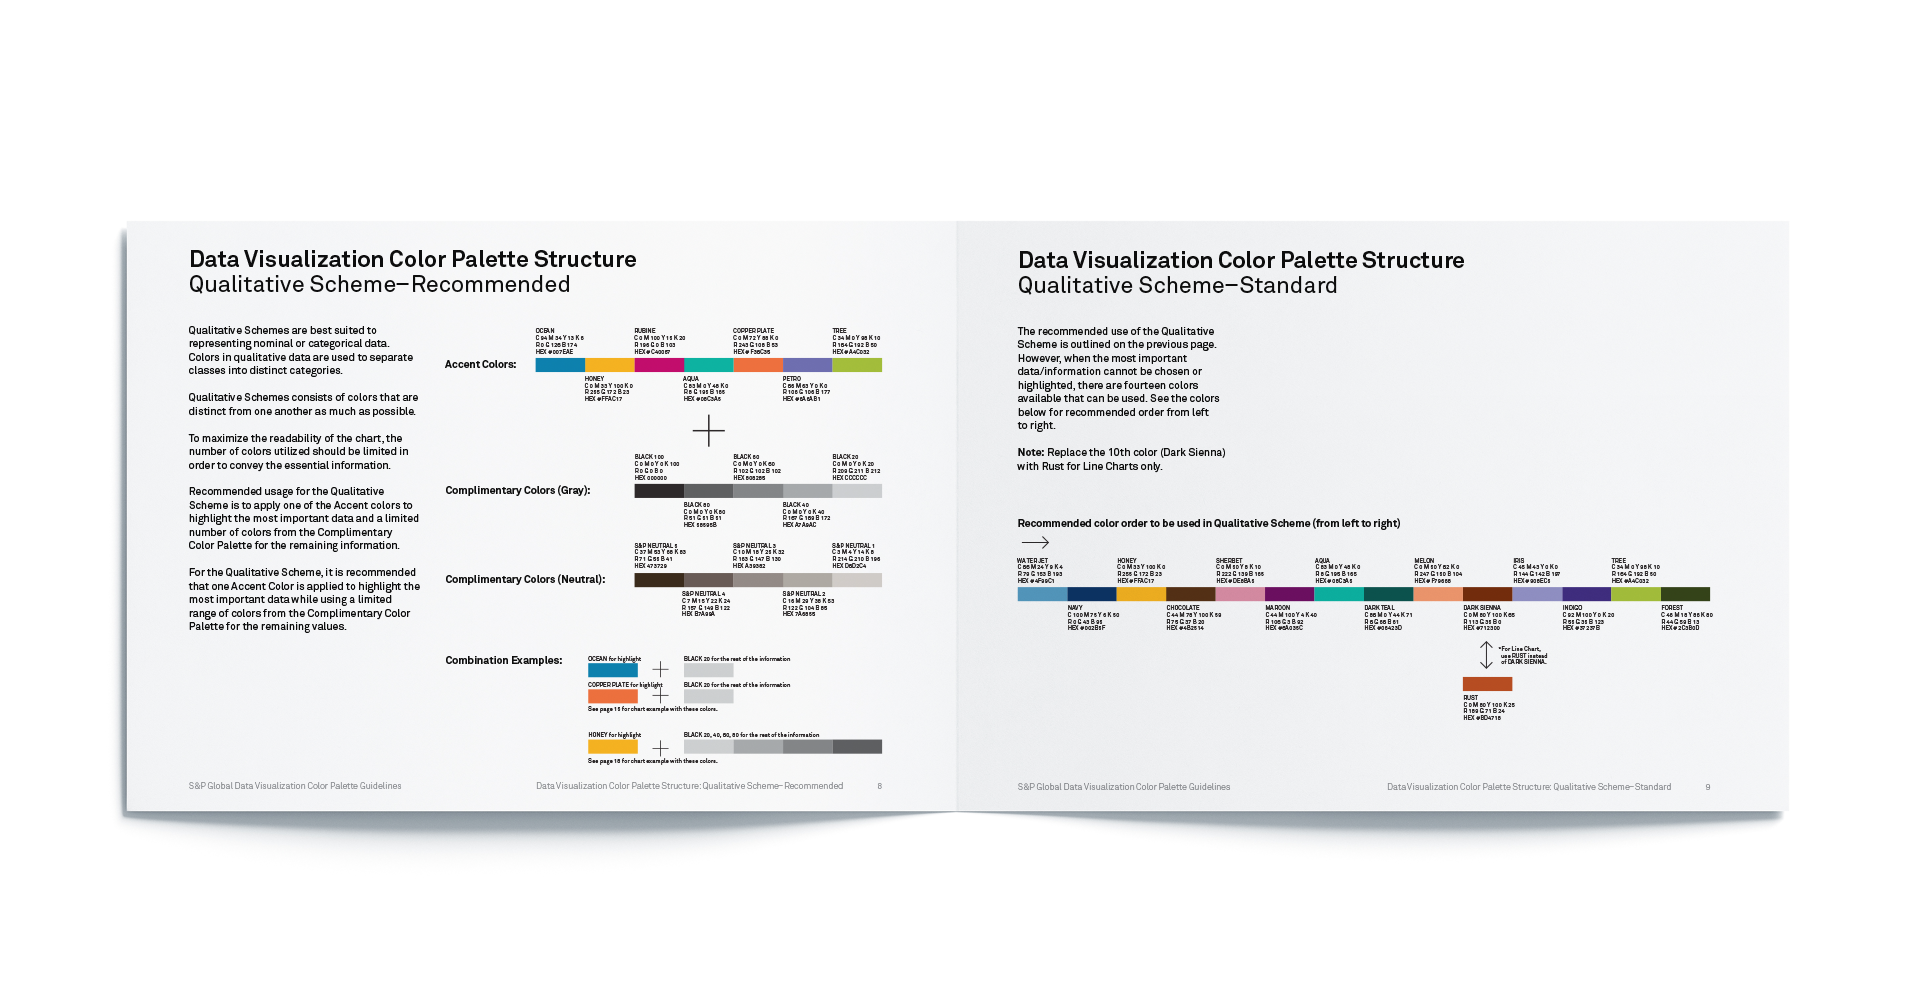
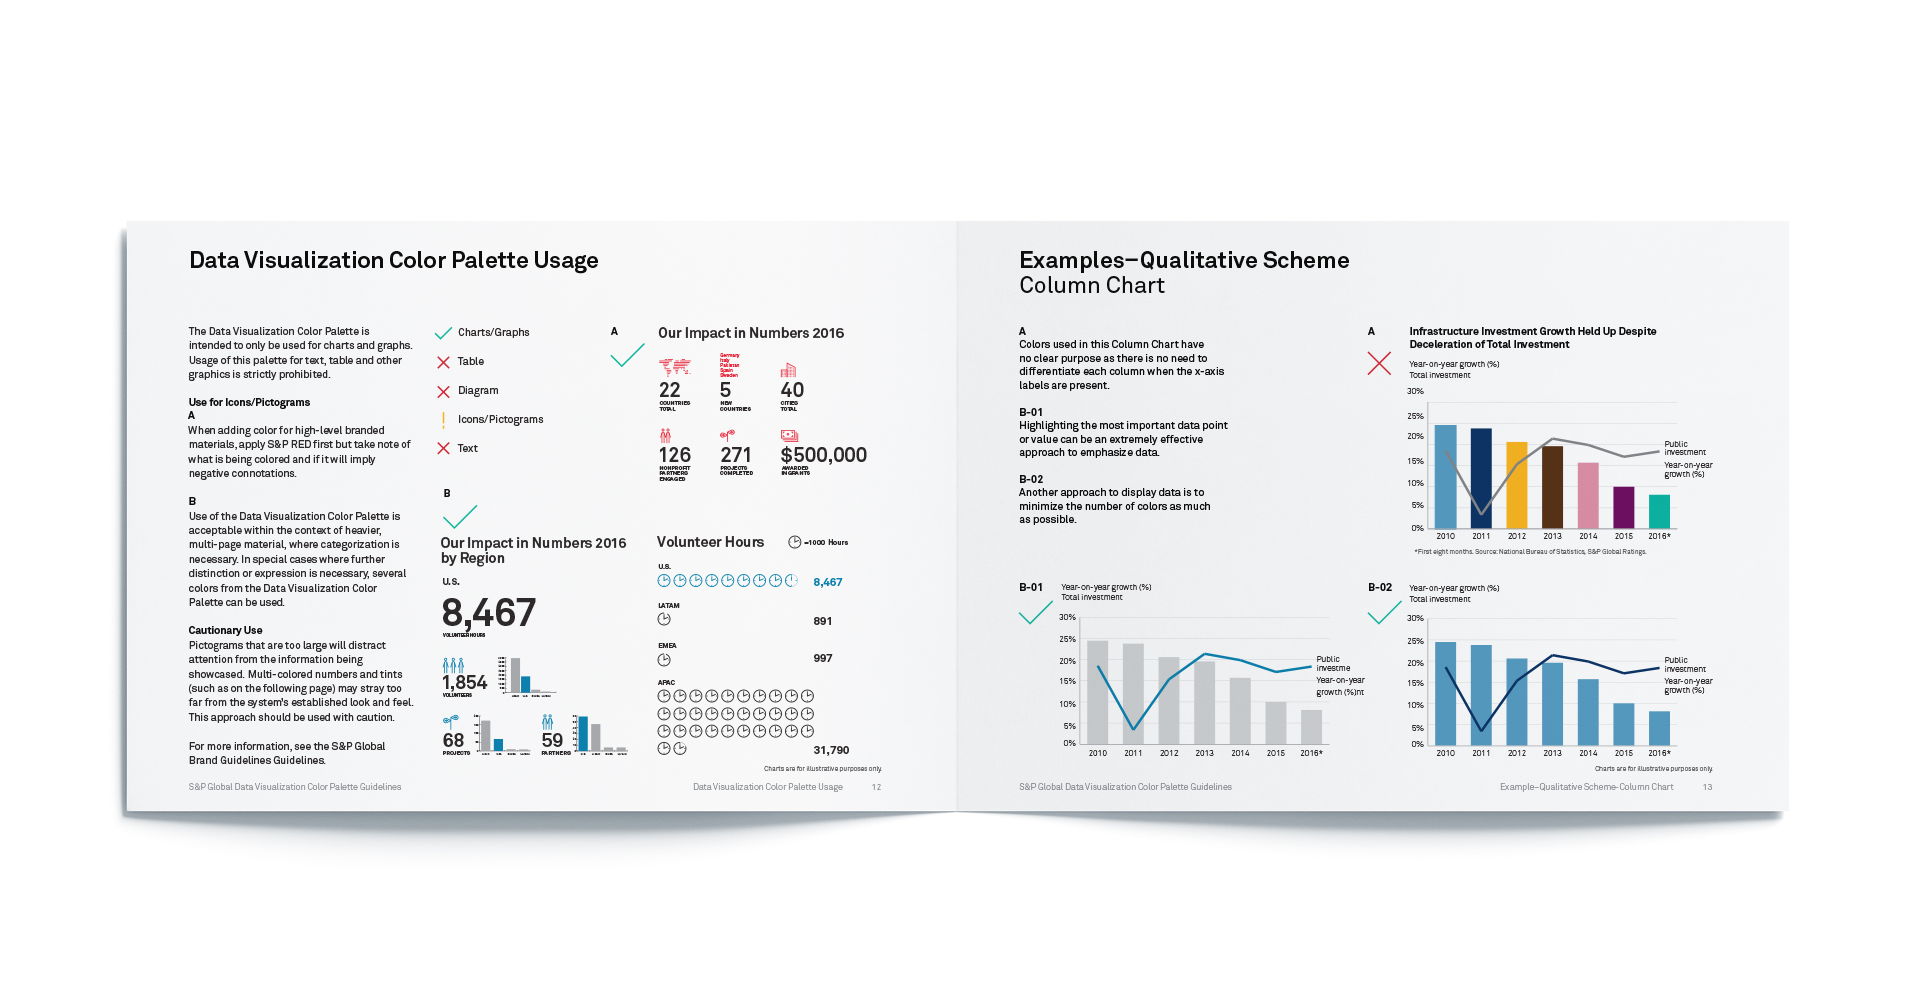
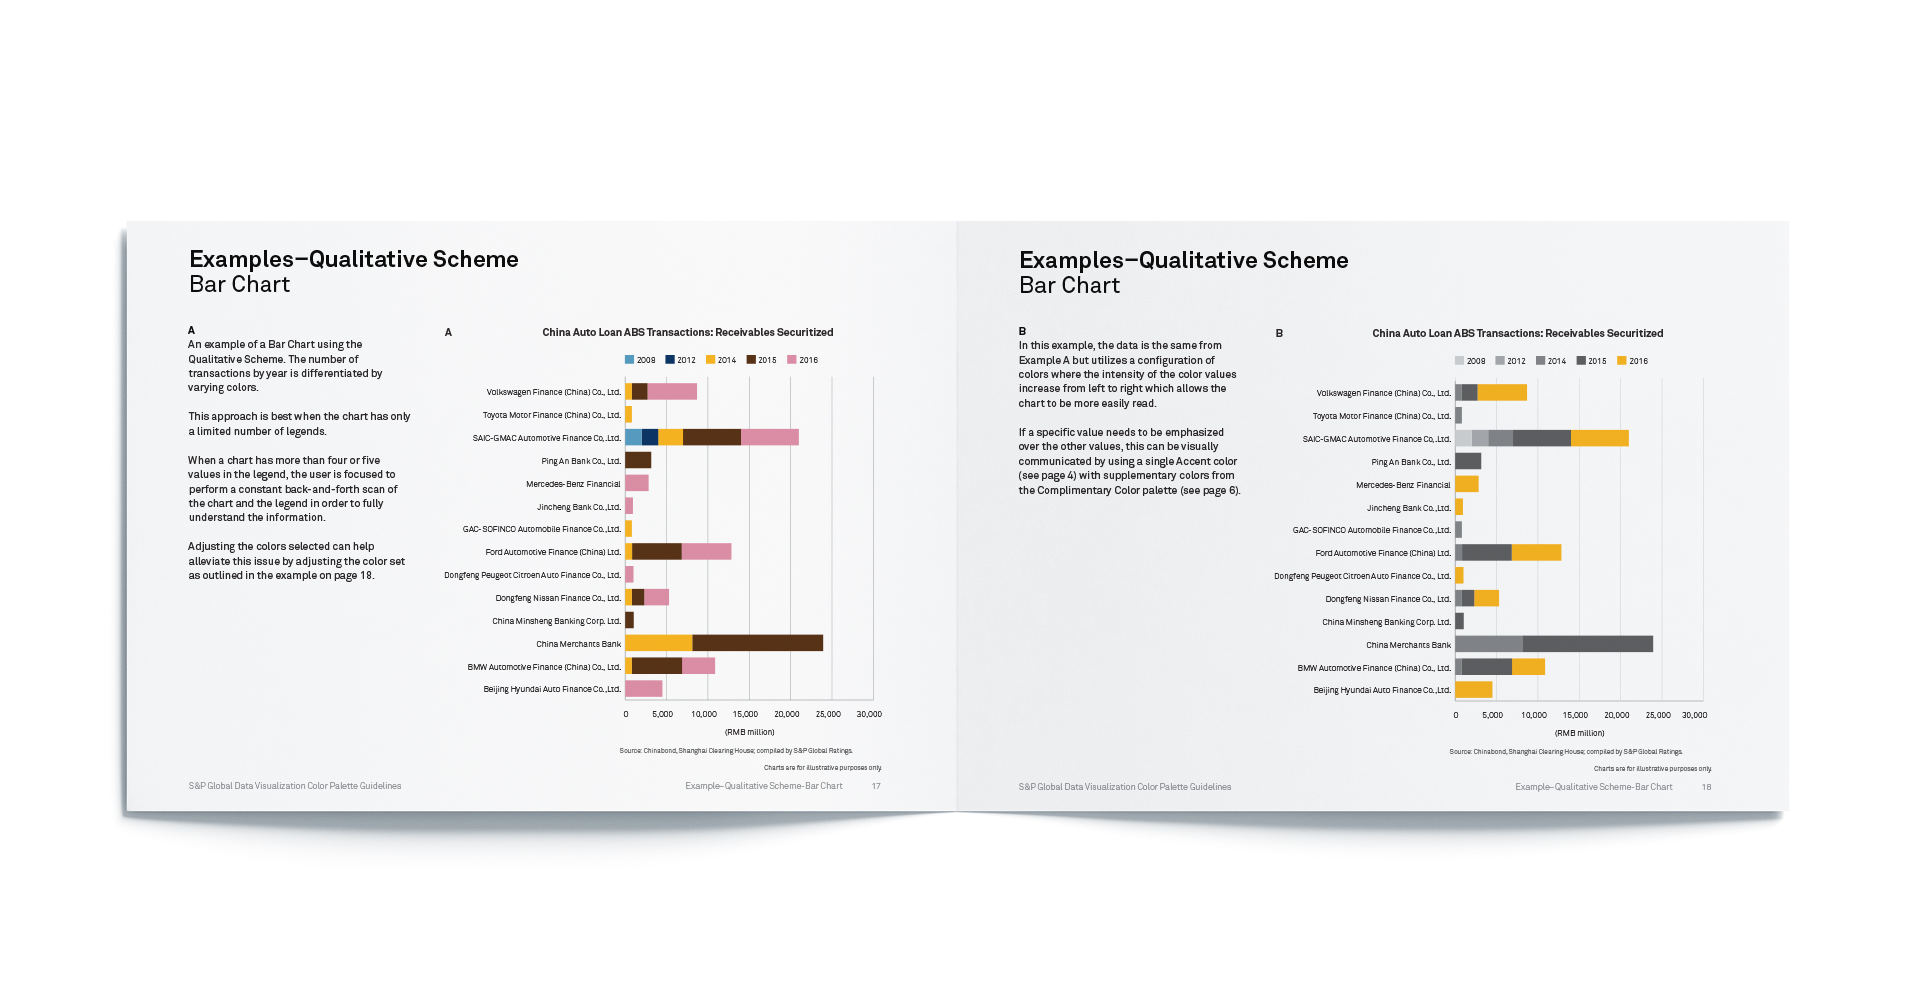
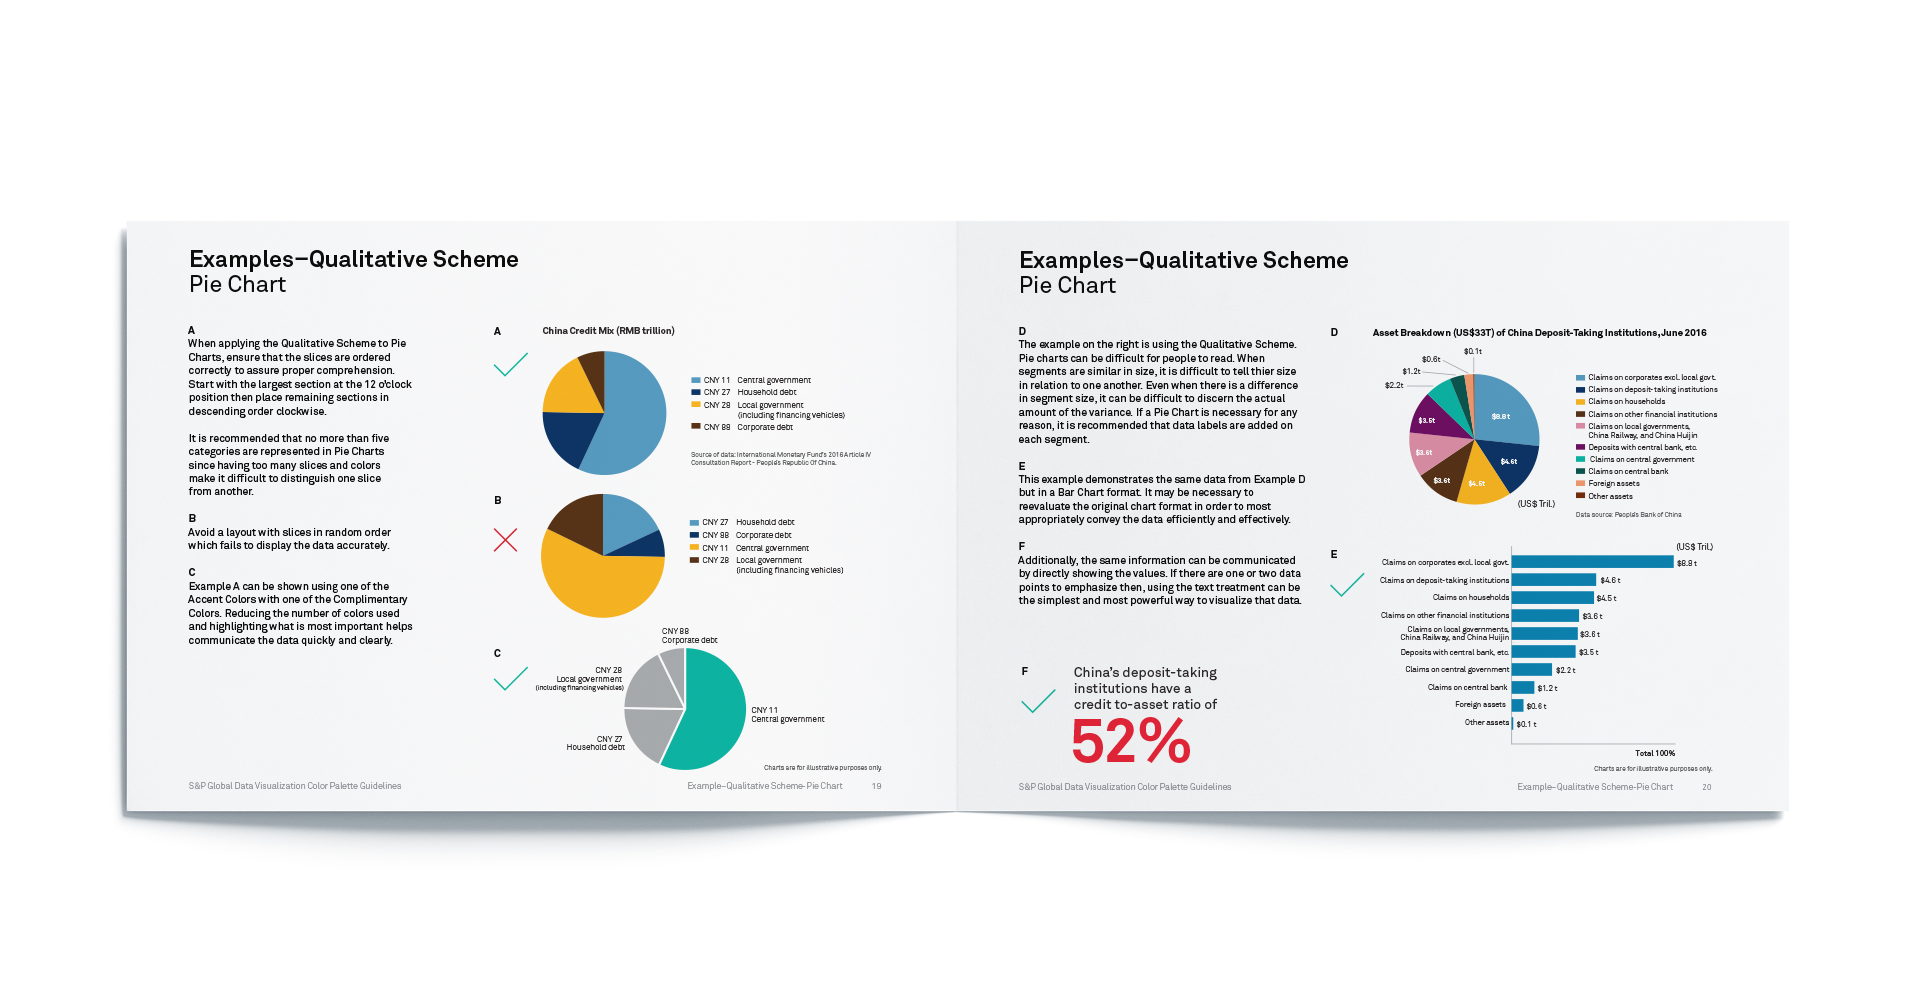
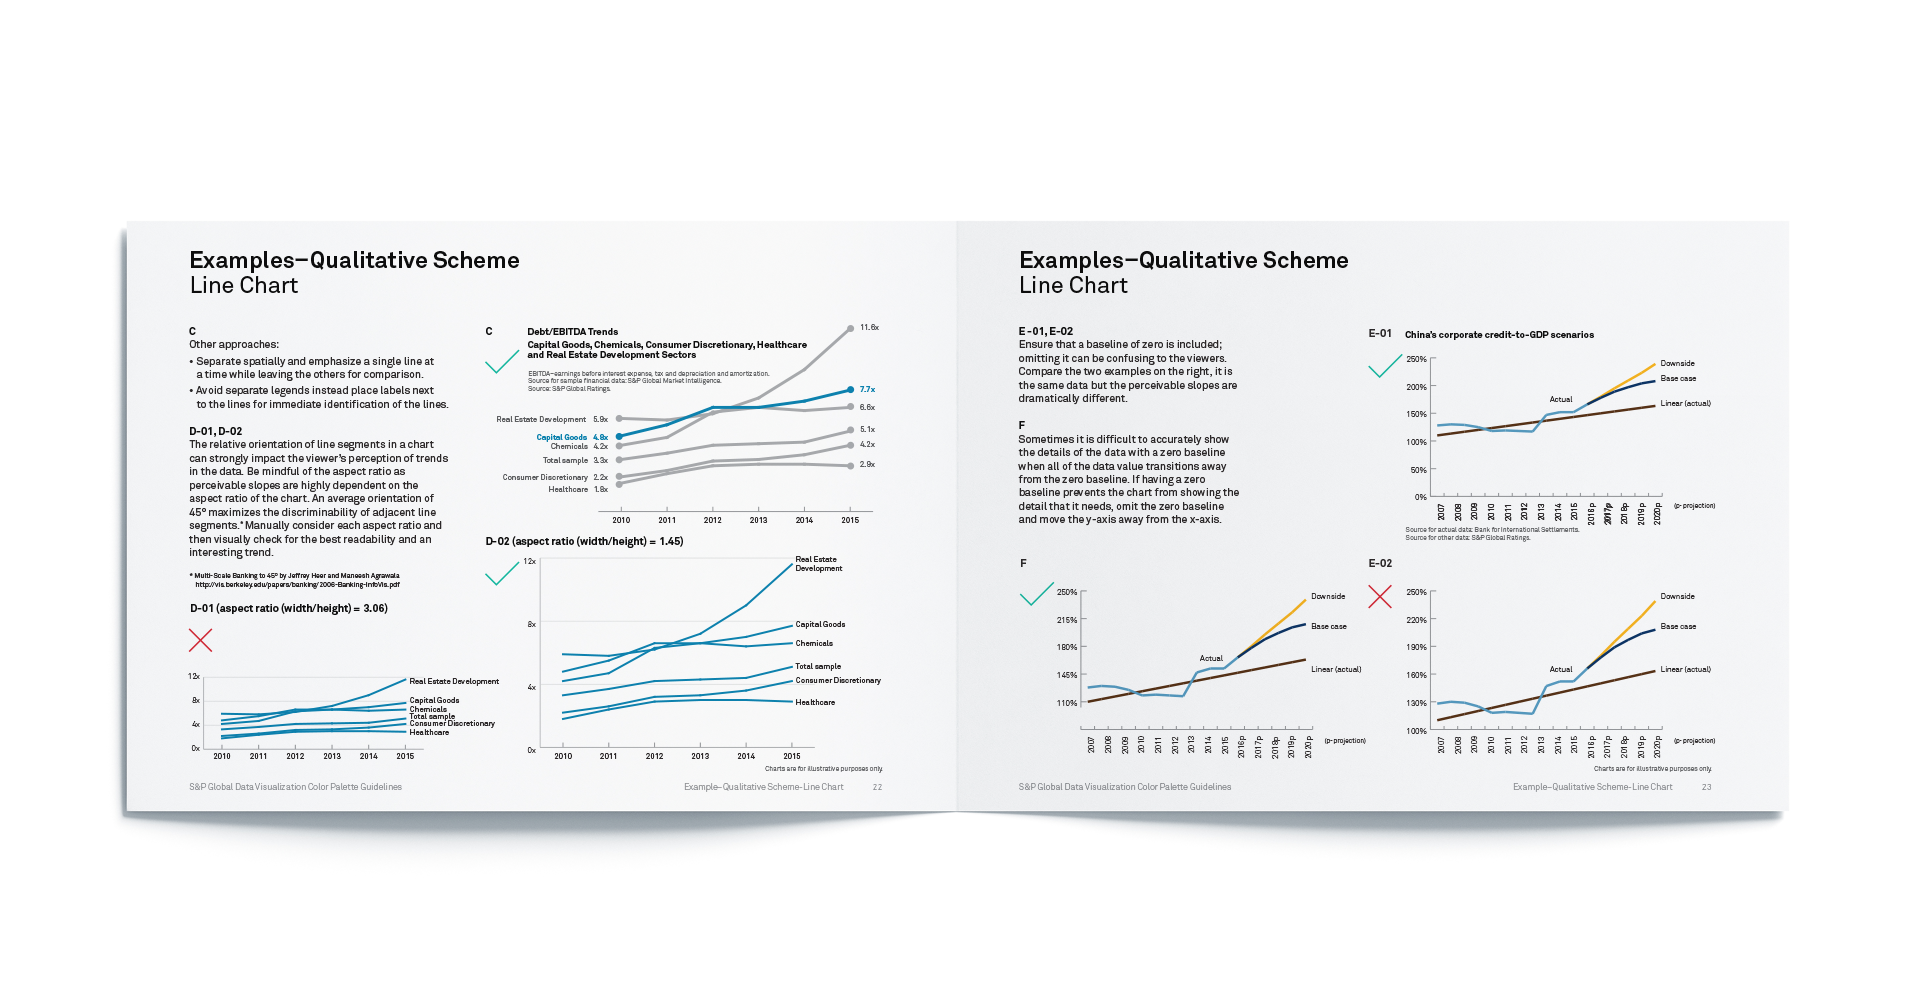
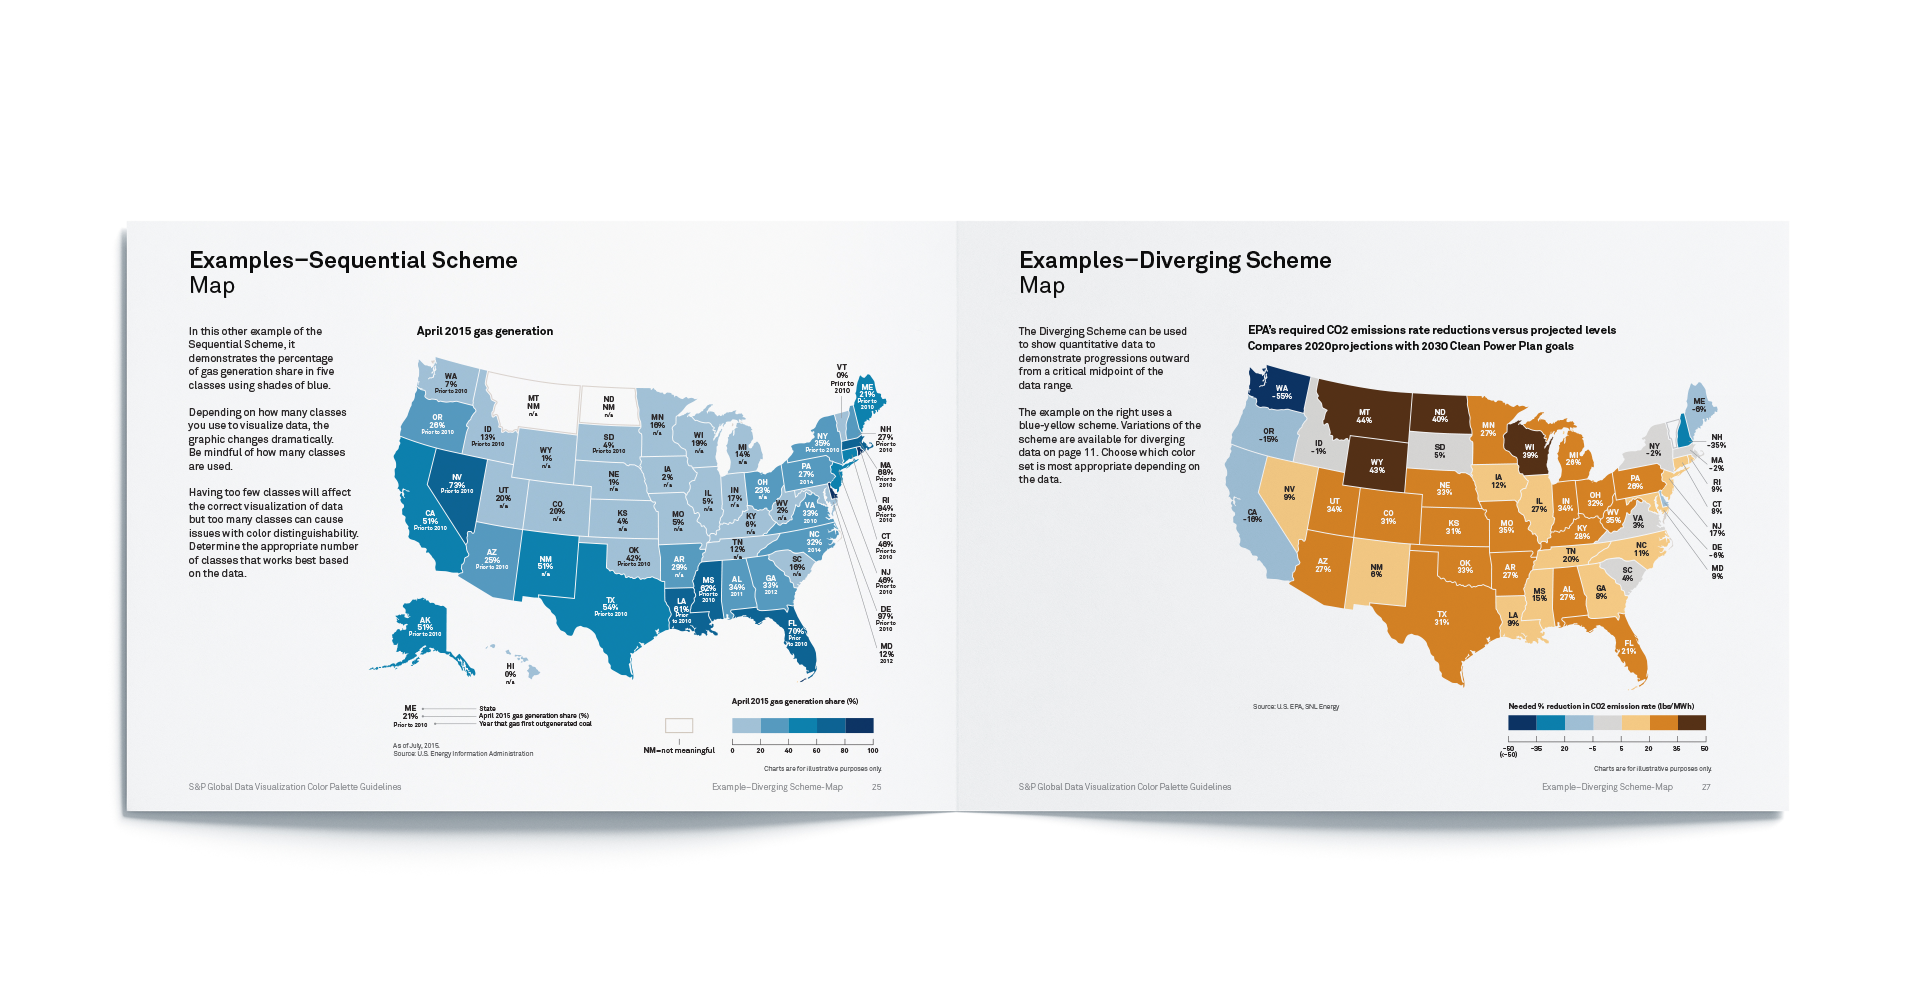
Examples of color usage were included in the guidelines.
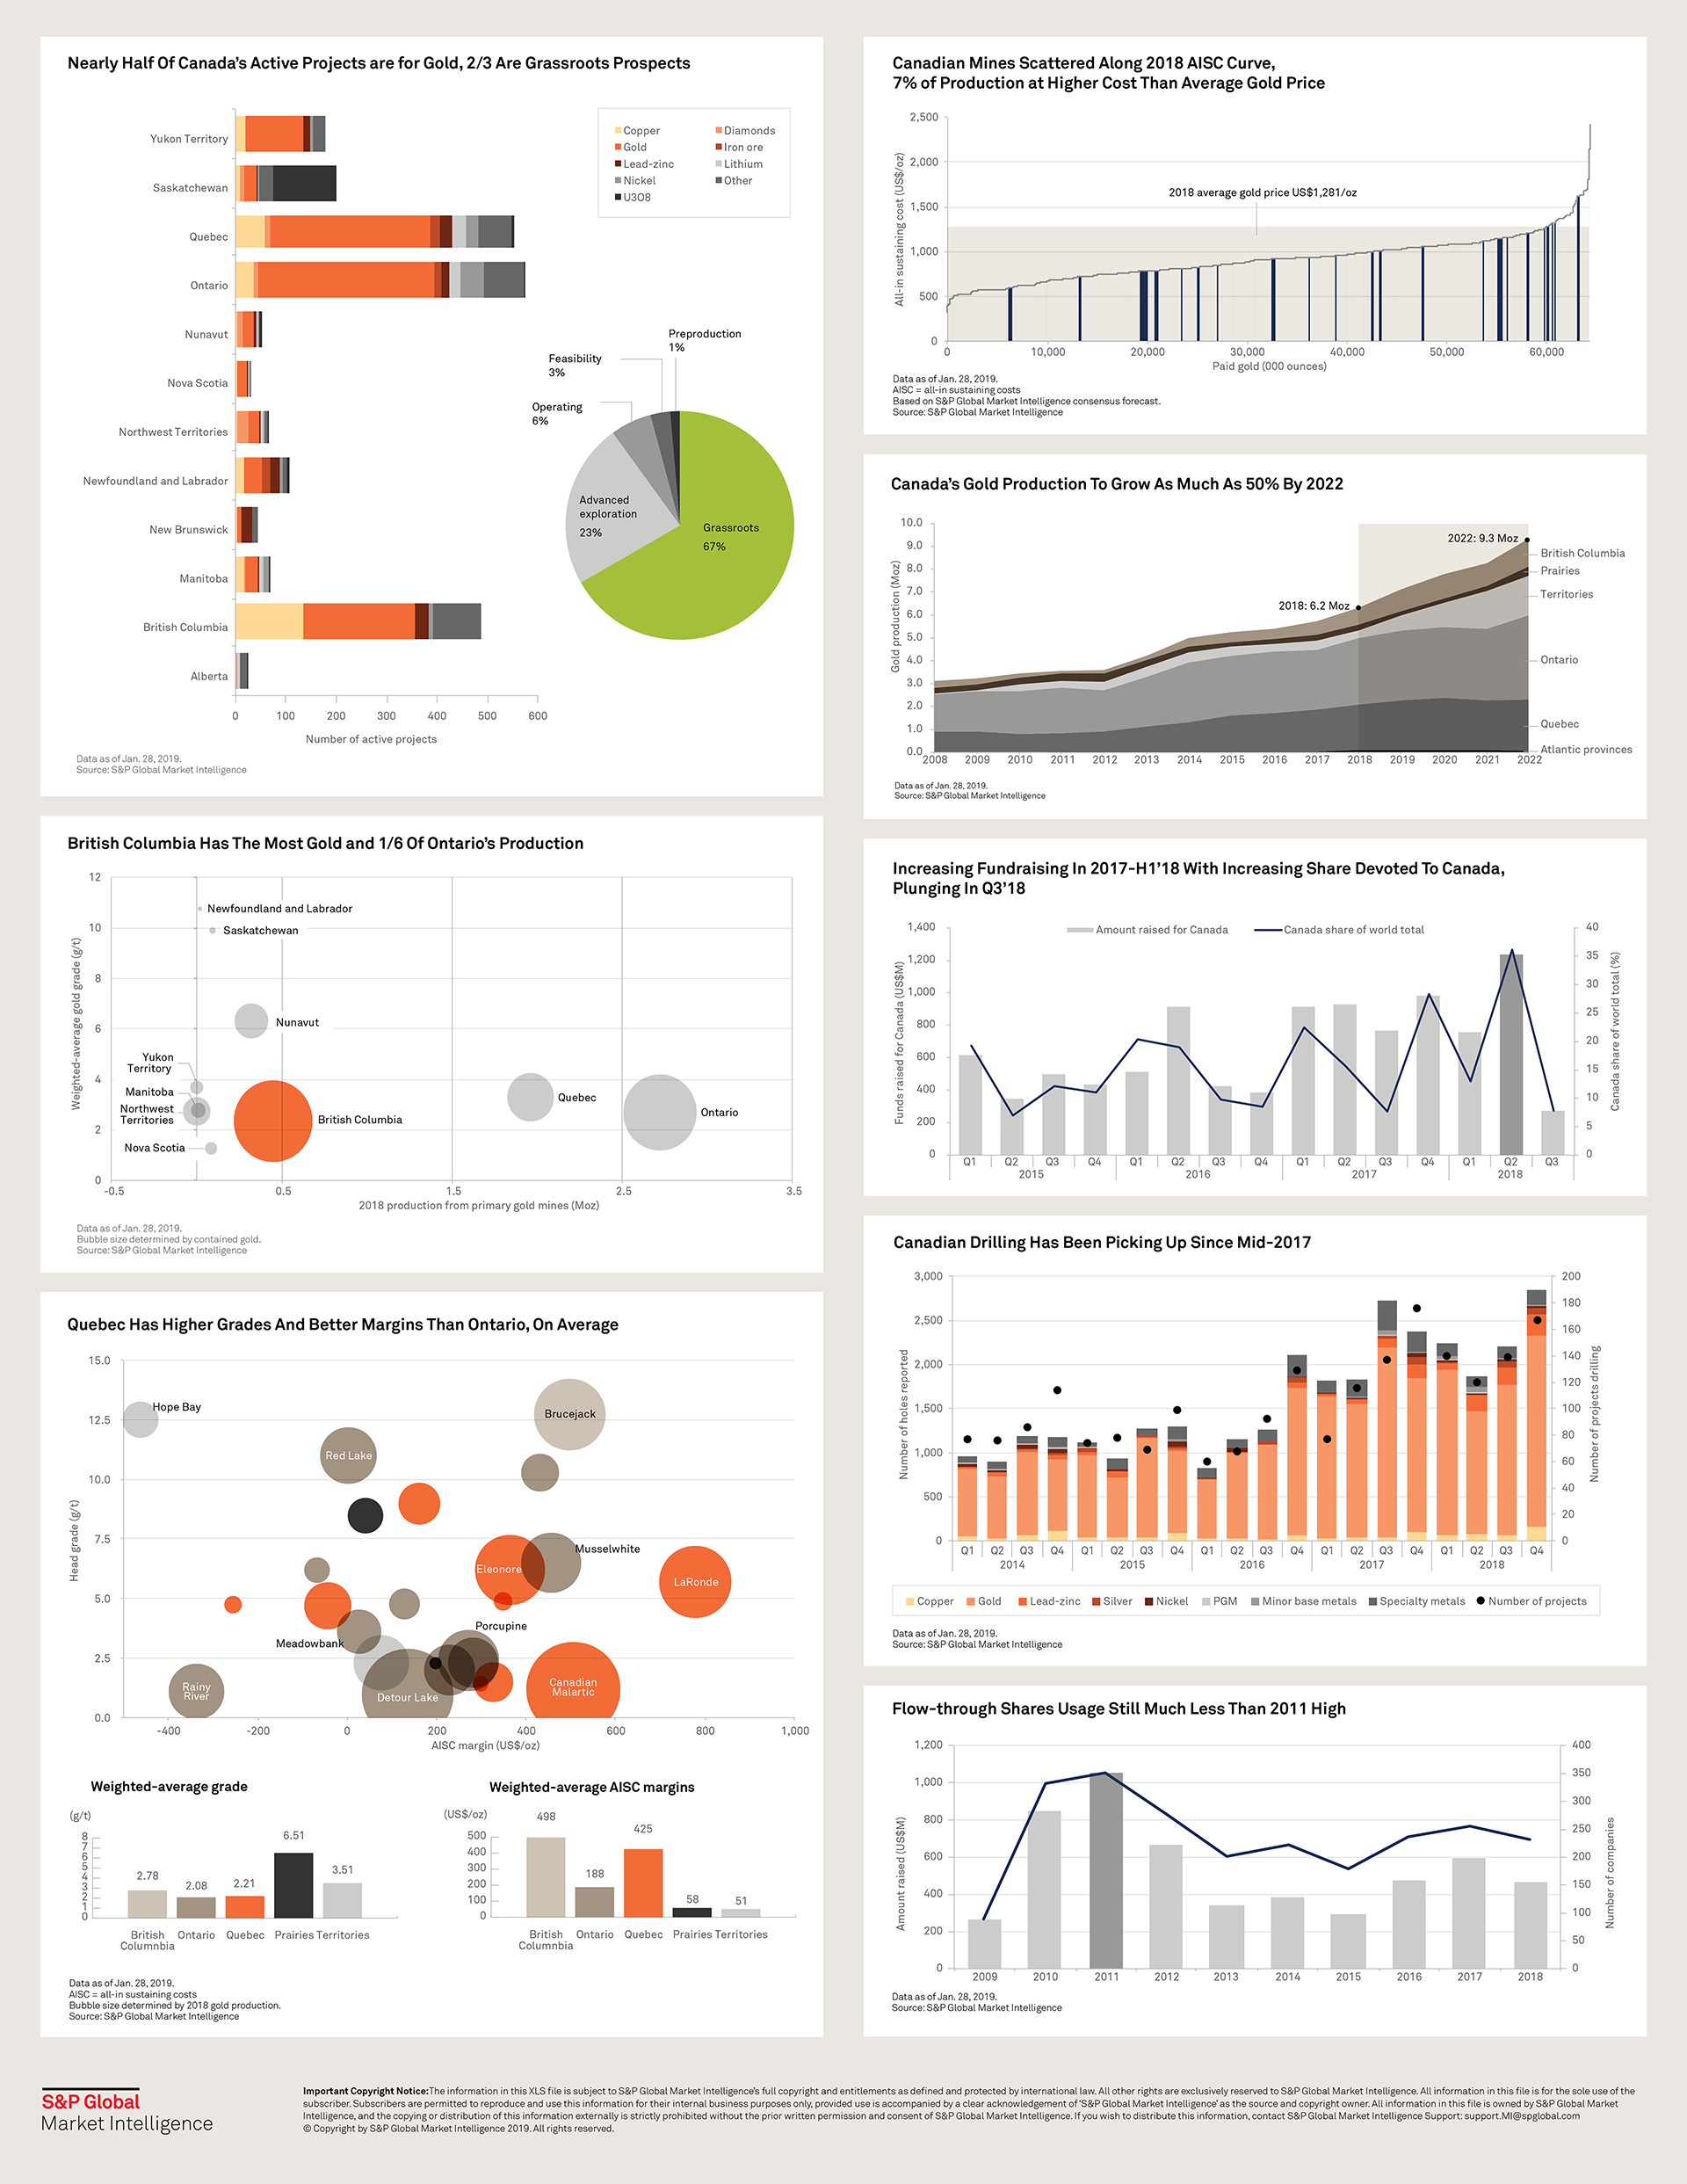
Data Visualization Color Palette implemented in Canadian Mining by the Numbers brochure.
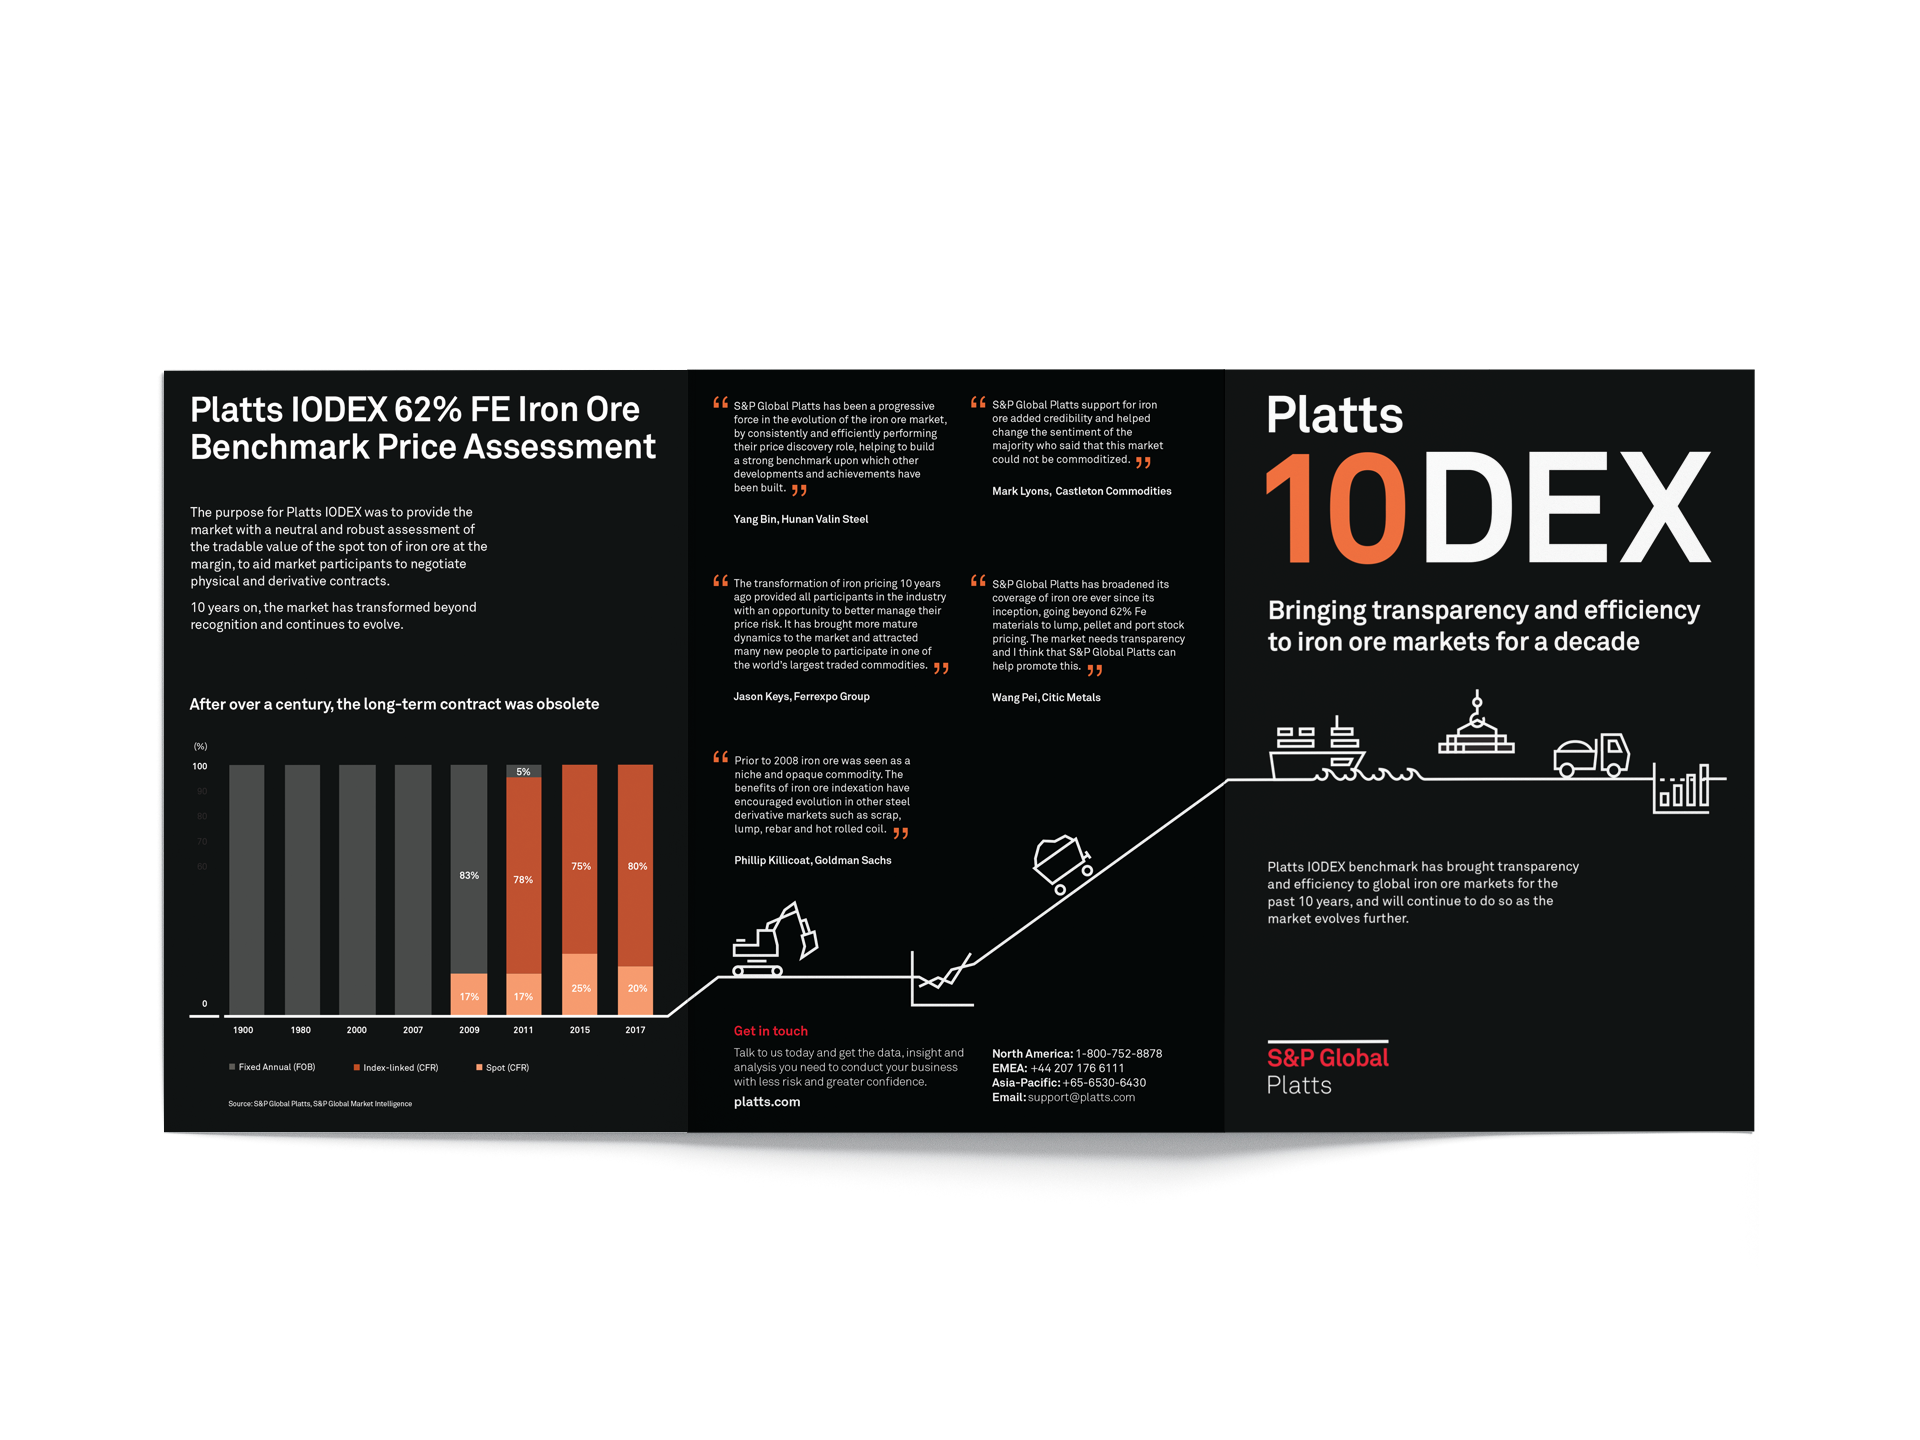
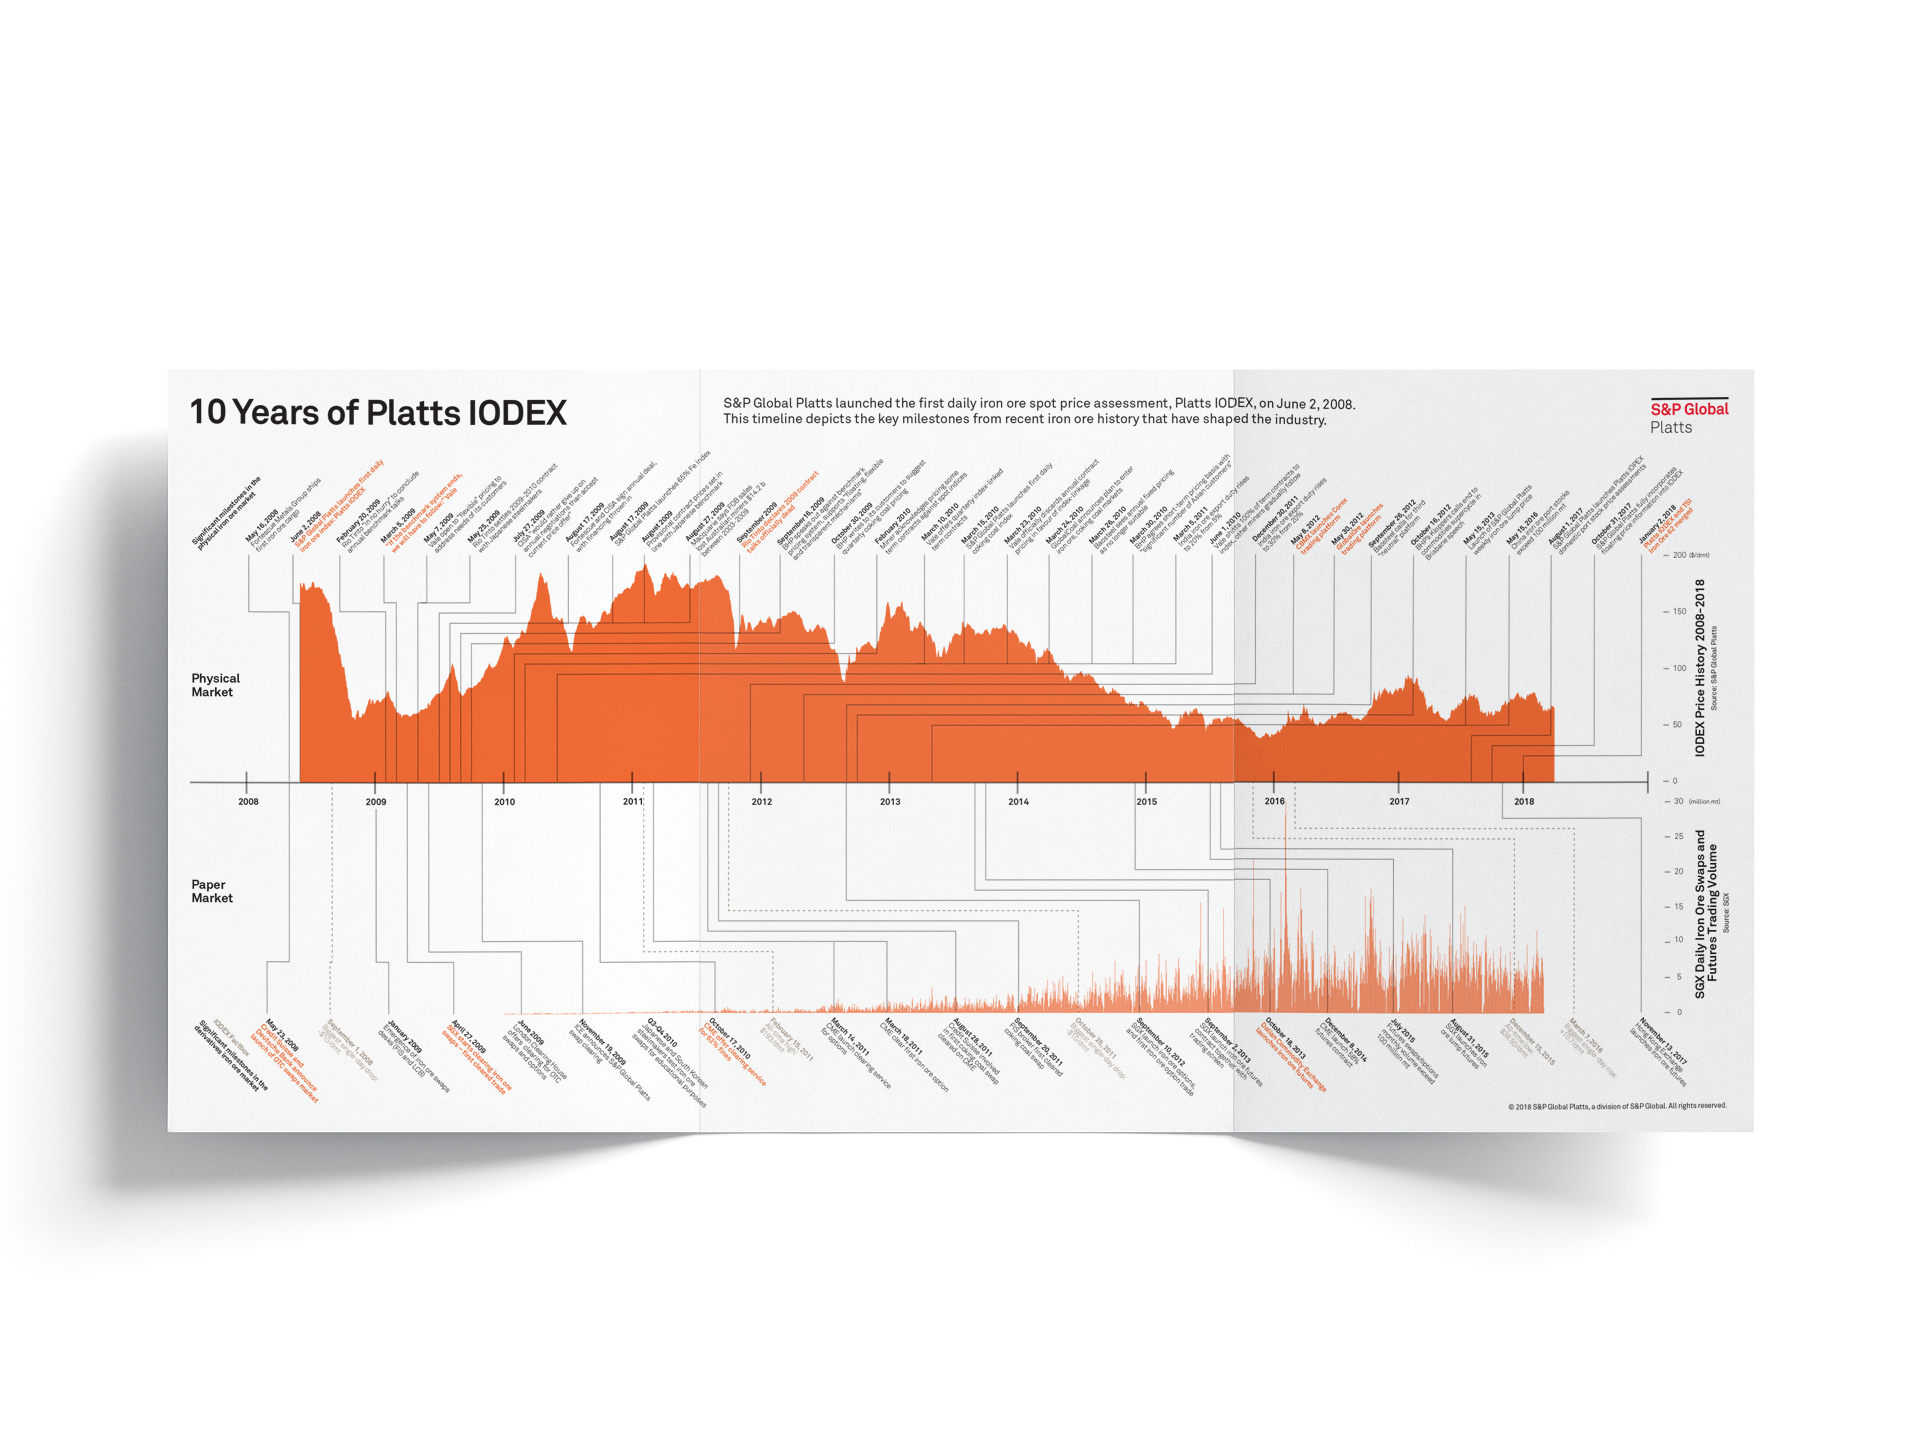
Data Visualization Color Palette implemented in the trifold infographic brochureIron.